library(corrplot)
library(data.table)
library(flextable)
library(ggplot2)
library(readxl)
library(mirt)
library(psych)

# Read Excel and convert to data.table representation
dark_tetrad_scale <-
  as.data.table(read_excel("Redes - Short Dark Tetrad.xlsx"))

# Translate columns
old_names <- c(
  "Sexo",
  "Idade",
  "Estado civil",
  "Cor ou raça",
  "Região",
  "Situação trabalhista (Selecione mais de um caso necessário)",
  "prof_est",
  "prof_est_rem",
  "prof_atuantes",
  "prof_desem",
  "prof_apos",
  "Renda mensal (Salário mínimo R$ 1.212)"
)

new_names <- c(
  "sex",
  "age",
  "marital_status",
  "ethnicity",
  "region",
  "employment_status",
  "student",
  "student_salary_job",
  "working_rofessional",
  "unemployed",
  "retired",
  "monthly_income"
)

setnames(dark_tetrad_scale, old_names, new_names)

# Clean demographic columns
dark_tetrad_scale <- dark_tetrad_scale[!is.na(SD4_28)]
dark_tetrad_scale[, id := NULL]

employment_status_cols <- c("student", "student_salary_job", "working_rofessional", "unemployed", "retired")
dark_tetrad_scale[, (employment_status_cols) := lapply(.SD, function (x) fifelse(x == 1, "Yes", "No")), .SDcols = employment_status_cols]Scales in psychology tend to be built, validated, and then published. The extent of the validation typically follows an EFA-then-CFA approach. Item revisions may occur, but the end state is usually an attempt to make the alternative fit indices meet a given standard. At times, the approach to validation includes practices that are considered questionable, which makes future validation efforts difficult. Instead of identifying ways to fix the underlying scale, we get various model specifications trying to force a good-fitting model. This creates problems for researchers, who are left with a plethora of literature offering different ad hoc fixes to the same scale — and it raises the question of whether we are truly measuring the same thing each time.
The Scale
The Short Dark Tetrad (SD4) was developed by Paulhus et al. (2021). It contains 28 items that measure four factors: Machiavellianism, Narcissism, Psychopathy, and Sadism; each construct is measured by 7 items. Paulhus et al. ran two confirmatory factor analyses to validate the structure: a parcelled version (\(\chi^2 = 132\), \(p < .001\), \(CFI = 0.97\), \(RMSEA = 0.05\) \([95\%\text{ CI: } 0.04, 0.07]\), \(SRMR = 0.04\)) and a non-parcelled version (\(\chi^2 = 1691\), \(p < .001\), \(CFI = 0.88\), \(RMSEA = 0.077\) \([95\%\text{ CI: } 0.073, 0.080]\), \(SRMR = 0.07\)). Parcelling is problematic as it averages out localised areas of strain, resulting in model fits that present as excellent. This is evident in the reported model fits: the parcelled model appears exceptional based on relative fit indices, although it fails the chi-square test; whereas the non-parcelled version falls well below what is considered acceptable. Paulhus et al. reported the following omega reliabilities: 0.76 (Machiavellianism), 0.80 (Narcissism), 0.81 (Psychopathy), and 0.81 (Sadism).
| Item # | Scale / Factor | Wording |
|---|---|---|
| 1 | Machiavellianism | It’s not wise to let people know your secrets. |
| 2 | Machiavellianism | Whatever it takes, you must get the important people on your side. |
| 3 | Machiavellianism | Avoid direct conflict with others because they may be useful in the future. |
| 4 | Machiavellianism | Keep a low profile if you want to get your way. |
| 5 | Machiavellianism | Manipulating the situation takes planning. |
| 6 | Machiavellianism | Flattery is a good way to get people on your side. |
| 7 | Machiavellianism | I love it when a tricky plan succeeds. |
| 8 | Narcissism | People see me as a natural leader. |
| 9 | Narcissism | I have a unique talent for persuading people. |
| 10 | Narcissism | Group activities tend to be dull without me. |
| 11 | Narcissism | I know that I am special because people keep telling me so. |
| 12 | Narcissism | I have some exceptional qualities. |
| 13 | Narcissism | I’m likely to become a future star in some area. |
| 14 | Narcissism | I like to show off every now and then. |
| 15 | Psychopathy | People often say I’m out of control. |
| 16 | Psychopathy | I tend to fight against authorities and their rules. |
| 17 | Psychopathy | I’ve been in more fights than most people of my age and gender. |
| 18 | Psychopathy | I tend to dive in, then ask questions later. |
| 19 | Psychopathy | I’ve been in trouble with the law. |
| 20 | Psychopathy | I sometimes get into dangerous situations. |
| 21 | Psychopathy | People who mess with me always regret it. |
| 22 | Sadism | Watching a fistfight excites me. |
| 23 | Sadism | I really enjoy violent films and video games. |
| 24 | Sadism | It’s funny when idiots fall flat on their face. |
| 25 | Sadism | I enjoy watching violent sports. |
| 26 | Sadism | Some people deserve to suffer. |
| 27 | Sadism | Just for kicks, I’ve said mean things on social media. |
| 28 | Sadism | I know how to hurt someone with words alone. |
The SD4 was then translated for a Brazilian context by Guilhermino et al. (2025). The authors replicated the model using a non-parcelled approach (\(\chi^2(344) = 2219.66\), \(CFI = 0.93\), \(TLI = 0.92\), \(RMSEA = 0.08\) \([95\%\text{ CI: } 0.08, 0.09]\), \(SRMR = 0.08\)). No p-value was reported for the chi-square test, but given the sample size and magnitude of the statistic, significance is a near-certainty. Based on alternative fit indices, the model meets what is considered acceptable by conventional cutoffs, but falls short of “excellent.” Moreover, omega reliabilities showed degradation for Machiavellianism (0.70) and Narcissism (0.75); Psychopathy and Sadism reliability remained good (0.82 and 0.85 respectively). All items were retained, but Guilhermino et al. flagged low-loading items (e.g., Item 2, Whatever it takes, you must get the important people on your side).
A follow-up network analysis of the Brazilian-adapted SD4 by Guilhermino et al. (2026) prompted several structural departures from the original model. Specifically, Items 5 and 6 were dropped altogether. Five factors were identified, with Sadism splitting into Vicarious Sadism and Direct Sadism. The paper’s Results section reports the five-factor model fit as acceptable (\(CFI = 0.939\), \(TLI = 0.931\), \(RMSEA = 0.050\) \([90\%\text{ CI: } 0.047, 0.052]\)), though no χ² or df is disclosed for this specific model. Again, omega reliabilities showed problems with Machiavellianism (0.582) and Narcissism (0.782); Psychopathy, Vicarious Sadism, and Direct Sadism remained permissible (0.811, 0.839, and 0.824 respectively).
In sum, the original SD4 was validated using a method that masked localised problems. Since then, there has been repeated identification of problematic items, particularly in relation to the Machiavellianism factor. We have now arrived at an entirely different model representation: dropping two items and introducing a fifth factor. This is a problem for future researchers, as there is no replicability of the factor structure — even within a single paper, reported fit statistics for the same model don’t always agree with each other. There has been no sustained attempt to fix the scale at the item level; instead, each study jumps through hoops to find a model that fits the data at hand. Without a unified effort to address the underlying item problems, the likely trajectory is more competing specifications rather than a scale anyone can agree on.
All analyses used here use the open data sourced from Guilhermino et al. (2026).
Descriptive Statistics
Polychoric correlations are presented in Figure 1. Lines are used to demarcate the items of each factor.
Machiavellianism items (1-7) show low to moderate correlations (range: 0.08-0.57).
Narcissism items (8-14) show low to moderate correlations (range: 0.15-0.56).
Psychopathy items (15-21) show moderate correlations (range: 0.30-0.65).
Sadism items (22-28) show moderate to strong correlations (range: 0.34-0.80).
This shows that items for Psychopathy and Sadism hang together well — a respondent is likely to respond consistently across these items. It aligns with the results of Guilhermino et al. (2025) that shows these two factors to be the strongest in terms of loadings. Meanwhile, Machiavellianism and Narcissism contain items that can be considered weaker; Guilhermino et al. (2025) found weaker loadings for these factors. It does suggest that there has been too much focus on the general fit of the model, as opposed to identifying localised strain that could be corrected (e.g., item wording).
Looking at Machiavellianism, Item 1 (It’s not wise to let people know your secrets) has an average within factor correlation of 0.19, and Item 2 (Whatever it takes, you must get the important people on your side) has an average within factor correlation of 0.16. In both cases, you would expect agreement from most respondents — being reluctant to divulge information and having important people siding with oneself are consistent of general behaviour unlike outright manipulation (Item 5 and 6).
With Narcissism, Item 10 (Group activities tend to be dull without me) has an average within factor correlation of 0.21, and Item 8 (People see me as a natural leader) has an average within factor correlation of 0.31. While both items convey a sense of grandiosity, they pale in comparison to other Narcissism items such as Item 11 (I know that I am special because people keep telling me so) and Item 13 (I’m likely to become a future star in some area). In other words, more people may consider themselves to have good leadership qualities and bring energy to group activities, but the majority are unlikely to see themselves as special or as future stars. This mirrors the pattern seen in Machiavellianism: items closer to normative self-presentation correlate more weakly with the trait than items capturing its more extreme, less socially palatable expression.
dt_polyc <- polychoric(dark_tetrad_scale[, .SD, .SDcols = patterns("^SD")])

dt_polyc$rho |>
  corrplot(type = "lower", method = "number") |>
  corrRect(index = c(1, 7)) |>
  corrRect(index = c(8, 14)) |>
  corrRect(index = c(15, 21)) |>
  corrRect(index = c(22, 28))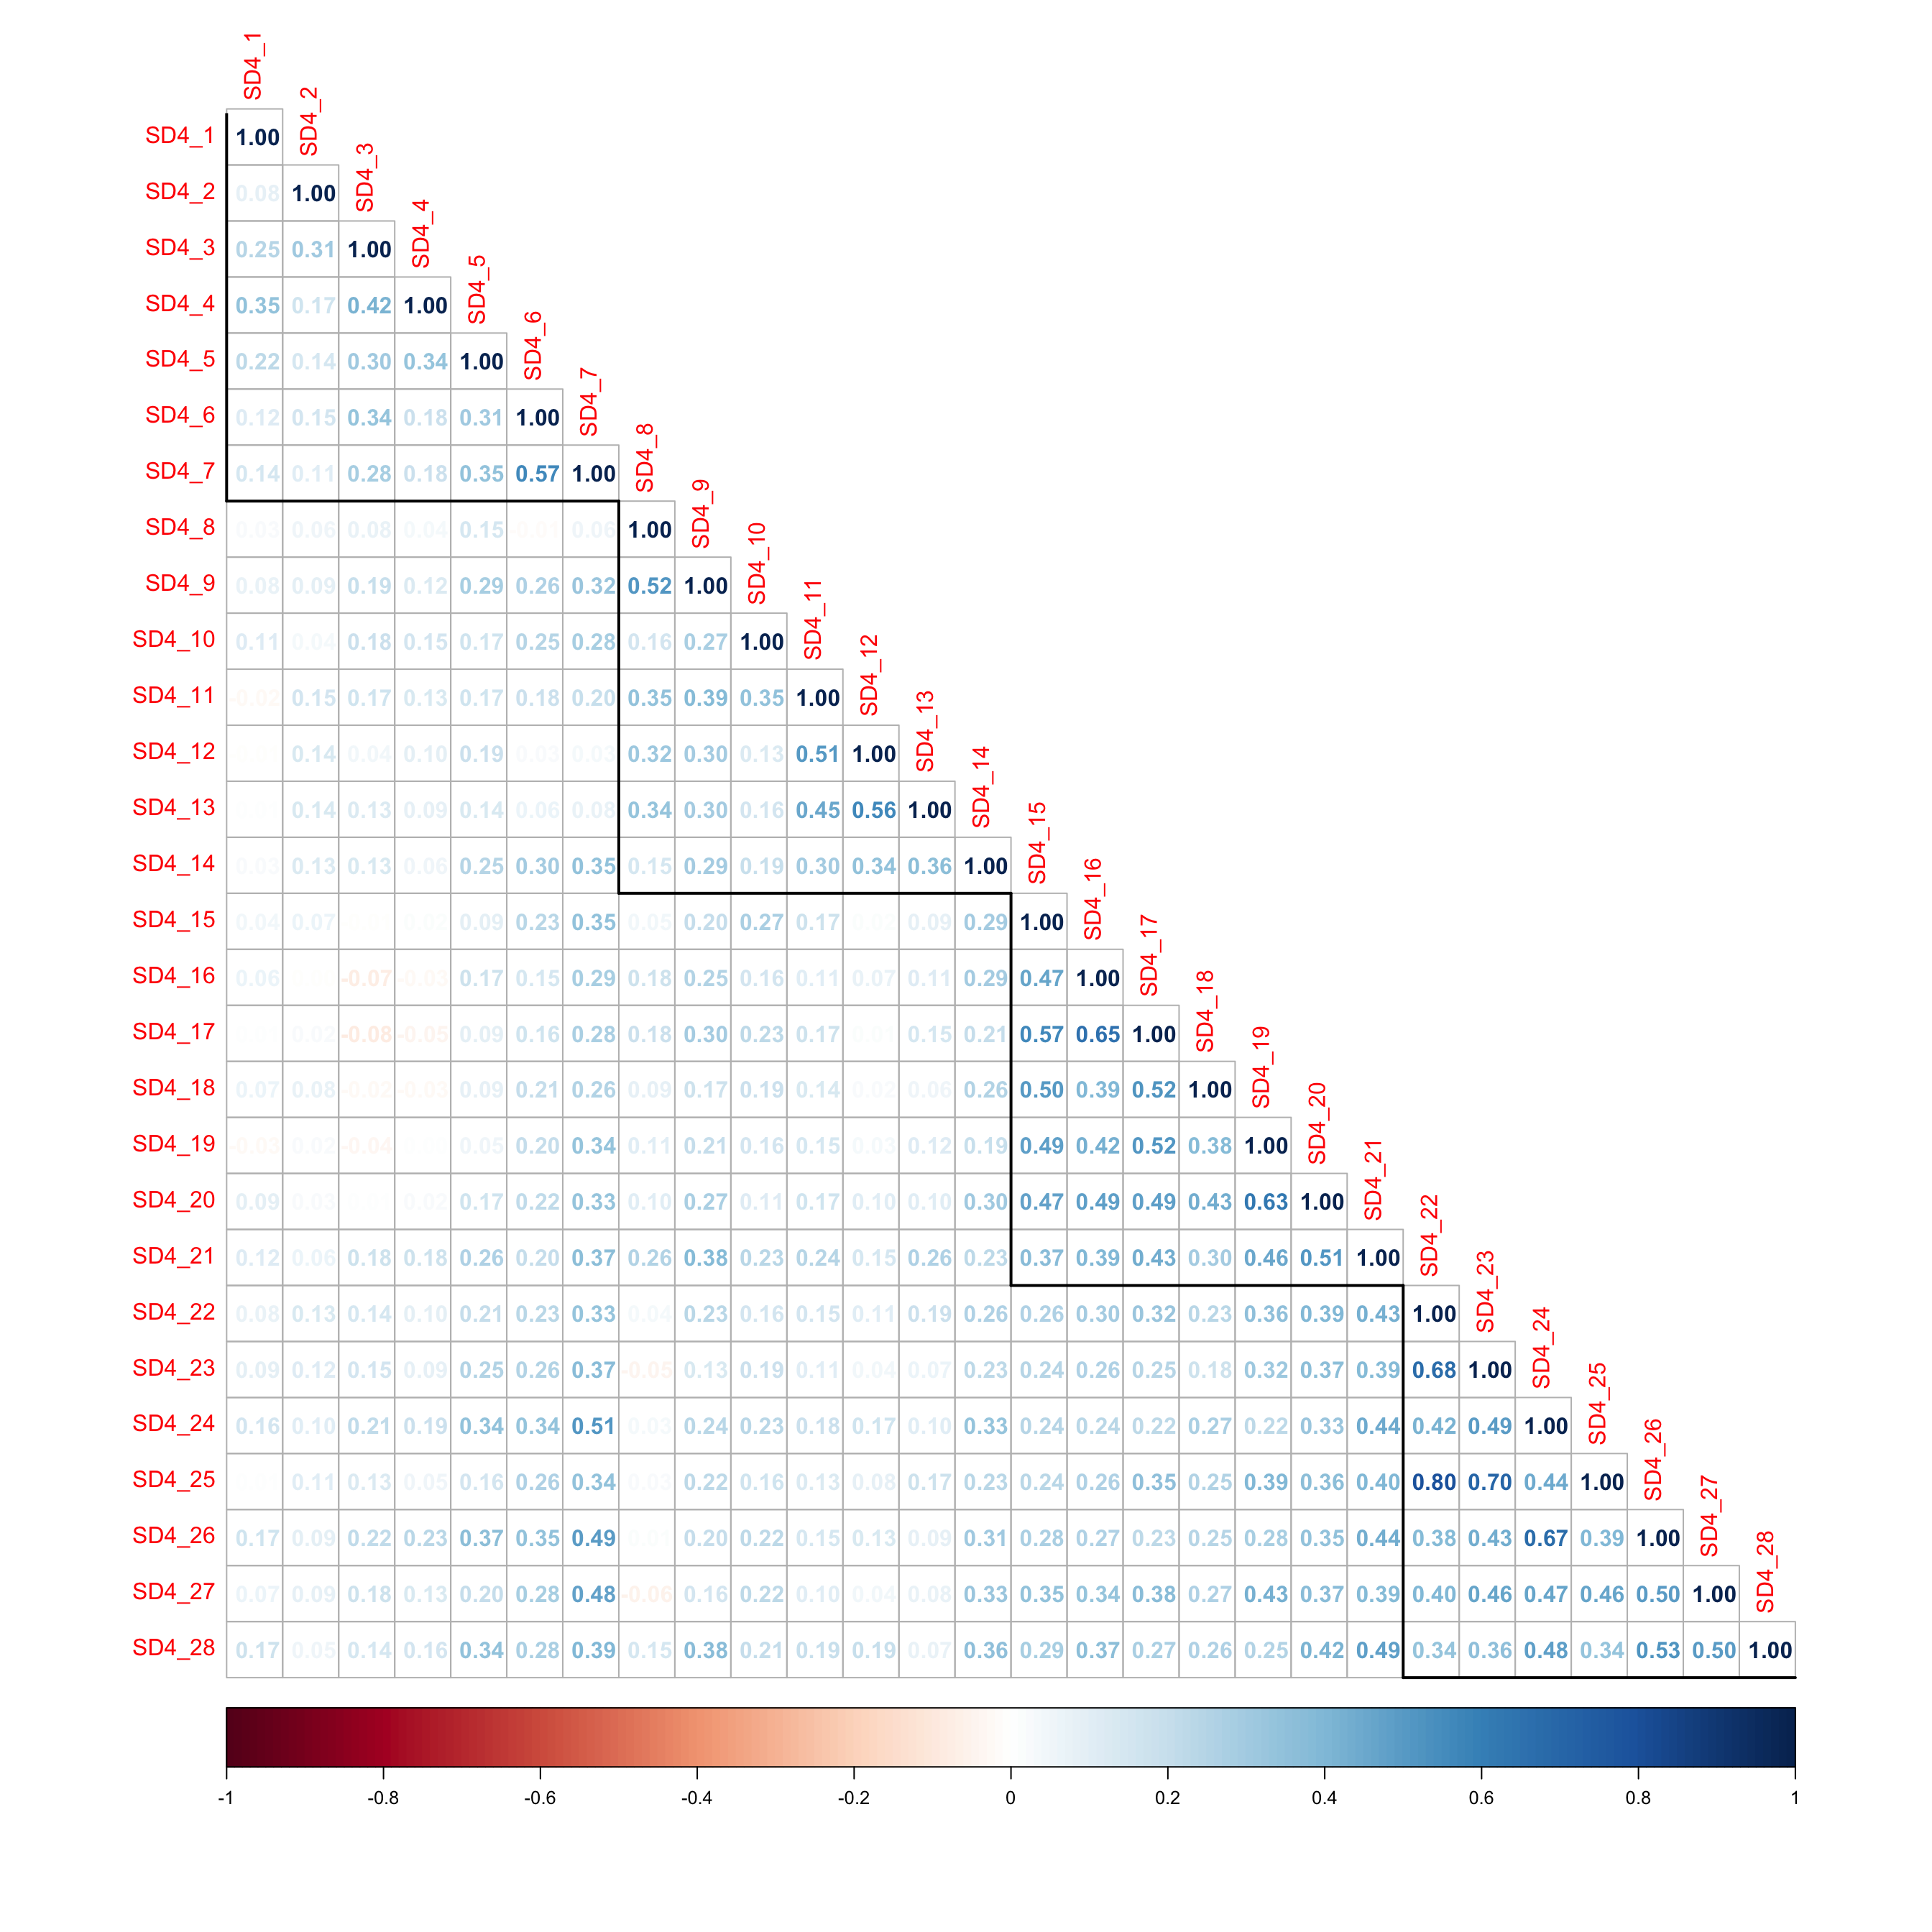
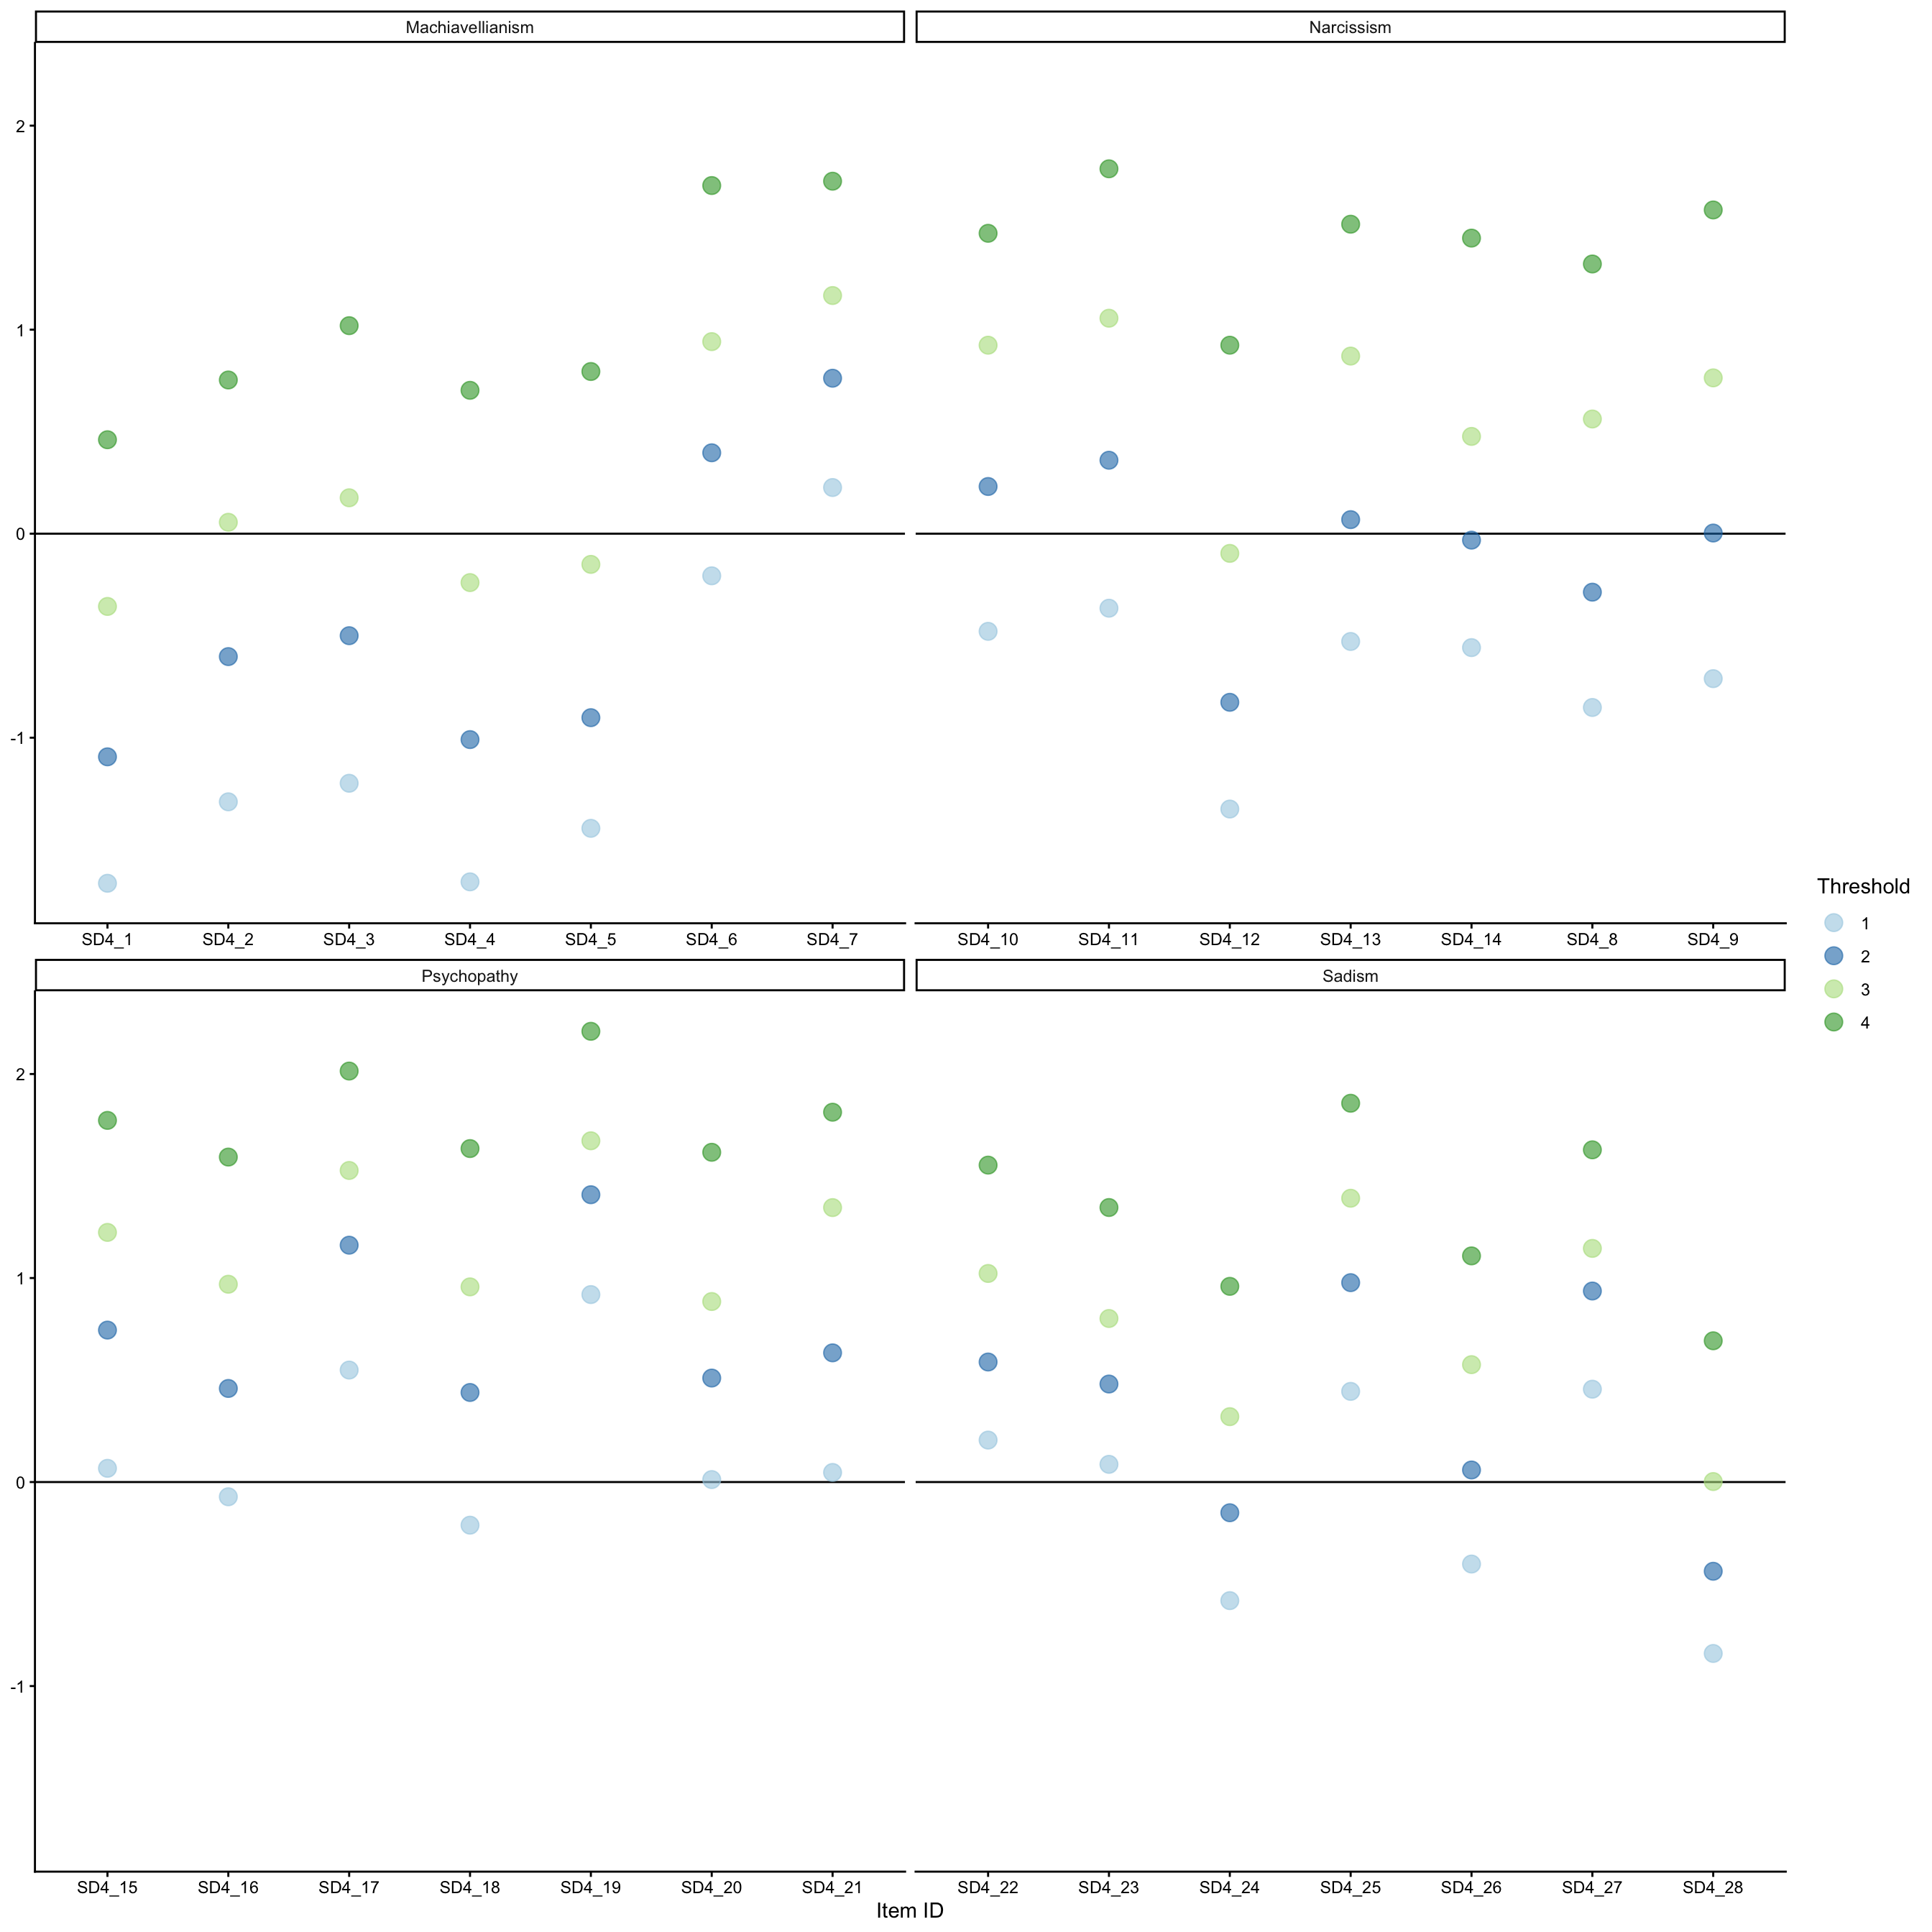
Figure 2 shows item thresholds for each factor follow a clear pattern: items associated with Psychopathy and Sadism require higher levels of the underlying trait to endorse, whilst Machiavellianism is composed mostly of easier, more readily endorsable items (Items 6 and 7 are exceptions). This mirrors the correlational pattern above — the items that hang together most tightly are also the hardest to endorse, while Machiavellianism’s comparatively normative content is both weakly correlated and easily agreed with.
dt_thresh <-
  dt_polyc$tau |>
  as.data.table(keep.rownames = "item_id")

dt_thresh[, construct := rep(c("Machiavellianism", "Narcissism", "Psychopathy", "Sadism"), each = 7)]

dt_thresh |>
  melt(id.vars = c("item_id", "construct")) |>
  ggplot(aes(x = item_id, y = value)) +
  geom_hline(yintercept = 0) +
  geom_point(aes(colour = variable, fill = variable), alpha = 0.6, shape = 21, size = 4) +
  facet_wrap(~construct, scales = "free_x") +
  theme_classic() +
  scale_colour_brewer(palette = 3, type = "qual") +
  scale_fill_brewer(palette = 3, type = "qual") +
  labs(
    x = "Item ID",
    y = NULL,
    colour = "Threshold",
    fill = "Threshold"
  )
Item Convergence
This item-level instability is not new, nor is it specific to this sample. Item 2 (Whatever it takes, you must get the important people on your side) has been flagged as underperforming since the scale’s original validation. Paulhus et al. (2021) reported the lowest Machiavellianism loading of the full 28-item set for this item (λ = .31), and Guilhermino et al. (2025) found it fell below the conventional .30 loading threshold entirely (λ = .28) in an independent Brazilian sample. This method-independent reanalysis of the most recent sample (Guilhermino et al., 2026) reaffirms this — Item 2 shows one of the weakest average within-factor correlations of any Machiavellianism item (0.16) under polychoric analysis.
Items 6 and 7 behave inconsistently with the rest of Machiavellianism: the threshold analysis above shows both requiring comparatively high trait levels to endorse, more akin to Psychopathy or Sadism content than to their own factor. This is consistent with Guilhermino et al. (2026): Item 6 was removed for low structural stability in the Exploratory Graph Analysis (EGA), and its content was flagged as a likely casualty of translation, reading less as strategic manipulation and more as excessive praise. Item 7 was not removed but reassigned, showing stronger network ties to Sadism than to Machiavellianism. This was attributed, post hoc, to satisfaction derived from another’s misfortune rather than a motivation to hurt.
Taken together, these patterns suggest two distinct sources of strain within the same factor. Item 2 is a straightforward psychometric weak point, replicated across independent samples and methods, that continues to be carried forward. Items 6 and 7, by contrast, look less like weak items than misplaced ones. The content behaves more like Sadism or Psychopathy than Machiavellianism, and both items are possibly better suited to revision or reassignment than removal.
Multi-Dimensional IRT (MIRT) Model
The original four-factor model is tested here using a graded MIRT model. All seven items are specified as loading onto their target factors, no cross-loadings are specified, and all factors freely correlate.
four_factor_mod <-
  mirt.model("
    mach = 1-7
    narc = 8-14
    psyc = 15-21
    sad = 22-28

    COV = mach * narc * psyc * sad
  ")

four_factor_fit <-
  mirt(
    dark_tetrad_scale[, .SD, .SDcols = patterns("^SD")],
    model = four_factor_mod,
    itemtype = "graded",
    method = "QMCEM"
  )
Warning: Log-likelihood was decreasing near the ML solution. EM method may be
unstablefour_factor_m2 <- M2(four_factor_fit)Warning: High-dimensional models should use quasi-Monte Carlo integration. Pass
QMC=TRUEThe model runs, but with a warning that the method may be unstable. The model fit is below what is considered acceptable for alternative fit indices, and the chi-square test is rejected (M2(260) = 1456.659, p < .001, CFI = 0.91, TLI = 0.89, RMSEA = 0.06 [95% CI: 0.05, 0.06], SRMSR = 0.08).
Table 1 presents item coefficients. The results show:
Machiavellianism remains the weakest factor, with Items 1 and 2 falling below the conventional item discrimination cut-offs (0.70).
Narcissism has a single weak item (Item 10) relative to its neighbouring items.
Psychopathy and Sadism contain the strongest items in terms of item discrimination values. Most items also require higher levels of the underlying latent to endorse.
coef(four_factor_fit, IRTpars = T, simplify = T)$items |>
  as.data.table(keep.rownames = "Item ID") |>
  flextable() |>
  colformat_double(digits = 3) |>
align_nottext_col(align = "center")Item ID | a1 | a2 | a3 | a4 | b1 | b2 | b3 | b4 |
|---|---|---|---|---|---|---|---|---|
SD4_1 | 0.555 | 0.000 | 0.000 | 0.000 | -5.814 | -3.502 | -1.098 | 1.435 |
SD4_2 | 0.517 | 0.000 | 0.000 | 0.000 | -4.558 | -1.977 | 0.200 | 2.524 |
SD4_3 | 1.130 | 0.000 | 0.000 | 0.000 | -2.228 | -0.891 | 0.305 | 1.834 |
SD4_4 | 0.901 | 0.000 | 0.000 | 0.000 | -3.797 | -2.134 | -0.490 | 1.479 |
SD4_5 | 1.249 | 0.000 | 0.000 | 0.000 | -2.463 | -1.488 | -0.242 | 1.333 |
SD4_6 | 1.394 | 0.000 | 0.000 | 0.000 | -0.319 | 0.613 | 1.464 | 2.753 |
SD4_7 | 1.760 | 0.000 | 0.000 | 0.000 | 0.300 | 1.027 | 1.606 | 2.452 |
SD4_8 | 0.000 | 1.118 | 0.000 | 0.000 | -1.524 | -0.493 | 0.998 | 2.419 |
SD4_9 | 0.000 | 1.410 | 0.000 | 0.000 | -1.086 | 0.019 | 1.174 | 2.538 |
SD4_10 | 0.000 | 0.778 | 0.000 | 0.000 | -1.080 | 0.582 | 2.221 | 3.637 |
SD4_11 | 0.000 | 1.800 | 0.000 | 0.000 | -0.487 | 0.471 | 1.415 | 2.517 |
SD4_12 | 0.000 | 1.484 | 0.000 | 0.000 | -2.067 | -1.211 | -0.106 | 1.409 |
SD4_13 | 0.000 | 1.554 | 0.000 | 0.000 | -0.755 | 0.111 | 1.259 | 2.269 |
SD4_14 | 0.000 | 1.066 | 0.000 | 0.000 | -1.016 | -0.043 | 0.878 | 2.770 |
SD4_15 | 0.000 | 0.000 | 1.717 | 0.000 | 0.131 | 1.071 | 1.733 | 2.541 |
SD4_16 | 0.000 | 0.000 | 1.725 | 0.000 | -0.067 | 0.672 | 1.363 | 2.255 |
SD4_17 | 0.000 | 0.000 | 2.361 | 0.000 | 0.698 | 1.419 | 1.853 | 2.485 |
SD4_18 | 0.000 | 0.000 | 1.323 | 0.000 | -0.304 | 0.742 | 1.573 | 2.734 |
SD4_19 | 0.000 | 0.000 | 1.953 | 0.000 | 1.225 | 1.857 | 2.213 | 2.990 |
SD4_20 | 0.000 | 0.000 | 1.941 | 0.000 | 0.050 | 0.713 | 1.196 | 2.163 |
SD4_21 | 0.000 | 0.000 | 1.500 | 0.000 | 0.107 | 0.988 | 2.056 | 2.811 |
SD4_22 | 0.000 | 0.000 | 0.000 | 1.964 | 0.281 | 0.765 | 1.331 | 2.071 |
SD4_23 | 0.000 | 0.000 | 0.000 | 1.962 | 0.138 | 0.648 | 1.068 | 1.798 |
SD4_24 | 0.000 | 0.000 | 0.000 | 1.857 | -0.757 | -0.156 | 0.470 | 1.310 |
SD4_25 | 0.000 | 0.000 | 0.000 | 2.171 | 0.571 | 1.219 | 1.750 | 2.394 |
SD4_26 | 0.000 | 0.000 | 0.000 | 1.776 | -0.529 | 0.106 | 0.803 | 1.536 |
SD4_27 | 0.000 | 0.000 | 0.000 | 1.621 | 0.653 | 1.322 | 1.625 | 2.375 |
SD4_28 | 0.000 | 0.000 | 0.000 | 1.358 | -1.313 | -0.648 | 0.044 | 1.117 |
Table 2 presents the item fit statistics for all 28 items. Based on the current data, the following items can be flagged as problematic: 12, 13, 21, 22, 23, 26 and Item 28. In these instances, the items do not fit the specified model, causing notable sources of localised strain.
itemfit(four_factor_fit, na.rm = T, QMC = T) |>
  flextable() |>
  colformat_double(digits = 3) |>
  align_nottext_col(align = "center")
Sample size after row-wise response data removal: 1543item | S_X2 | df.S_X2 | RMSEA.S_X2 | p.S_X2 |
|---|---|---|---|---|
SD4_1 | 184.395 | 186.000 | 0.000 | 0.519 |
SD4_2 | 233.617 | 230.000 | 0.003 | 0.421 |
SD4_3 | 230.021 | 204.000 | 0.009 | 0.102 |
SD4_4 | 210.993 | 190.000 | 0.008 | 0.142 |
SD4_5 | 203.066 | 192.000 | 0.006 | 0.278 |
SD4_6 | 179.956 | 187.000 | 0.000 | 0.631 |
SD4_7 | 168.513 | 152.000 | 0.008 | 0.170 |
SD4_8 | 207.353 | 216.000 | 0.000 | 0.652 |
SD4_9 | 217.247 | 202.000 | 0.007 | 0.220 |
SD4_10 | 208.937 | 209.000 | 0.000 | 0.488 |
SD4_11 | 169.031 | 145.000 | 0.010 | 0.084 |
SD4_12 | 236.893 | 191.000 | 0.012 | 0.013 |
SD4_13 | 268.706 | 198.000 | 0.015 | 0.001 |
SD4_14 | 152.821 | 150.000 | 0.003 | 0.421 |
SD4_15 | 118.385 | 124.000 | 0.000 | 0.625 |
SD4_16 | 207.642 | 192.000 | 0.007 | 0.209 |
SD4_17 | 149.083 | 126.000 | 0.011 | 0.079 |
SD4_18 | 210.232 | 195.000 | 0.007 | 0.216 |
SD4_19 | 128.362 | 122.000 | 0.006 | 0.329 |
SD4_20 | 204.071 | 184.000 | 0.008 | 0.148 |
SD4_21 | 193.217 | 125.000 | 0.019 | 0.000 |
SD4_22 | 191.456 | 170.000 | 0.009 | 0.124 |
SD4_23 | 220.900 | 178.000 | 0.013 | 0.016 |
SD4_24 | 194.391 | 181.000 | 0.007 | 0.235 |
SD4_25 | 121.672 | 102.000 | 0.011 | 0.090 |
SD4_26 | 203.488 | 185.000 | 0.008 | 0.167 |
SD4_27 | 166.565 | 163.000 | 0.004 | 0.408 |
SD4_28 | 229.409 | 188.000 | 0.012 | 0.021 |
four_factor_resid <- residuals(four_factor_fit, type = "Q3", QMC = T) Warning: High-dimensional models factor scores should use quasi-Monte Carlo
integration. Pass QMC=TRUEResiduals in Figure 3 add weight to the sources of misfit in the model. Specific items with large amounts of strain appear to be items 7, 11, 12, 13, 20, 21, 22, 25, 26, and 28.
four_factor_resid |>
  corrplot(type = "lower", method = "number") |>
  corrRect(index = c(1, 7)) |>
  corrRect(index = c(8, 14)) |>
  corrRect(index = c(15, 21)) |>
  corrRect(index = c(22, 28))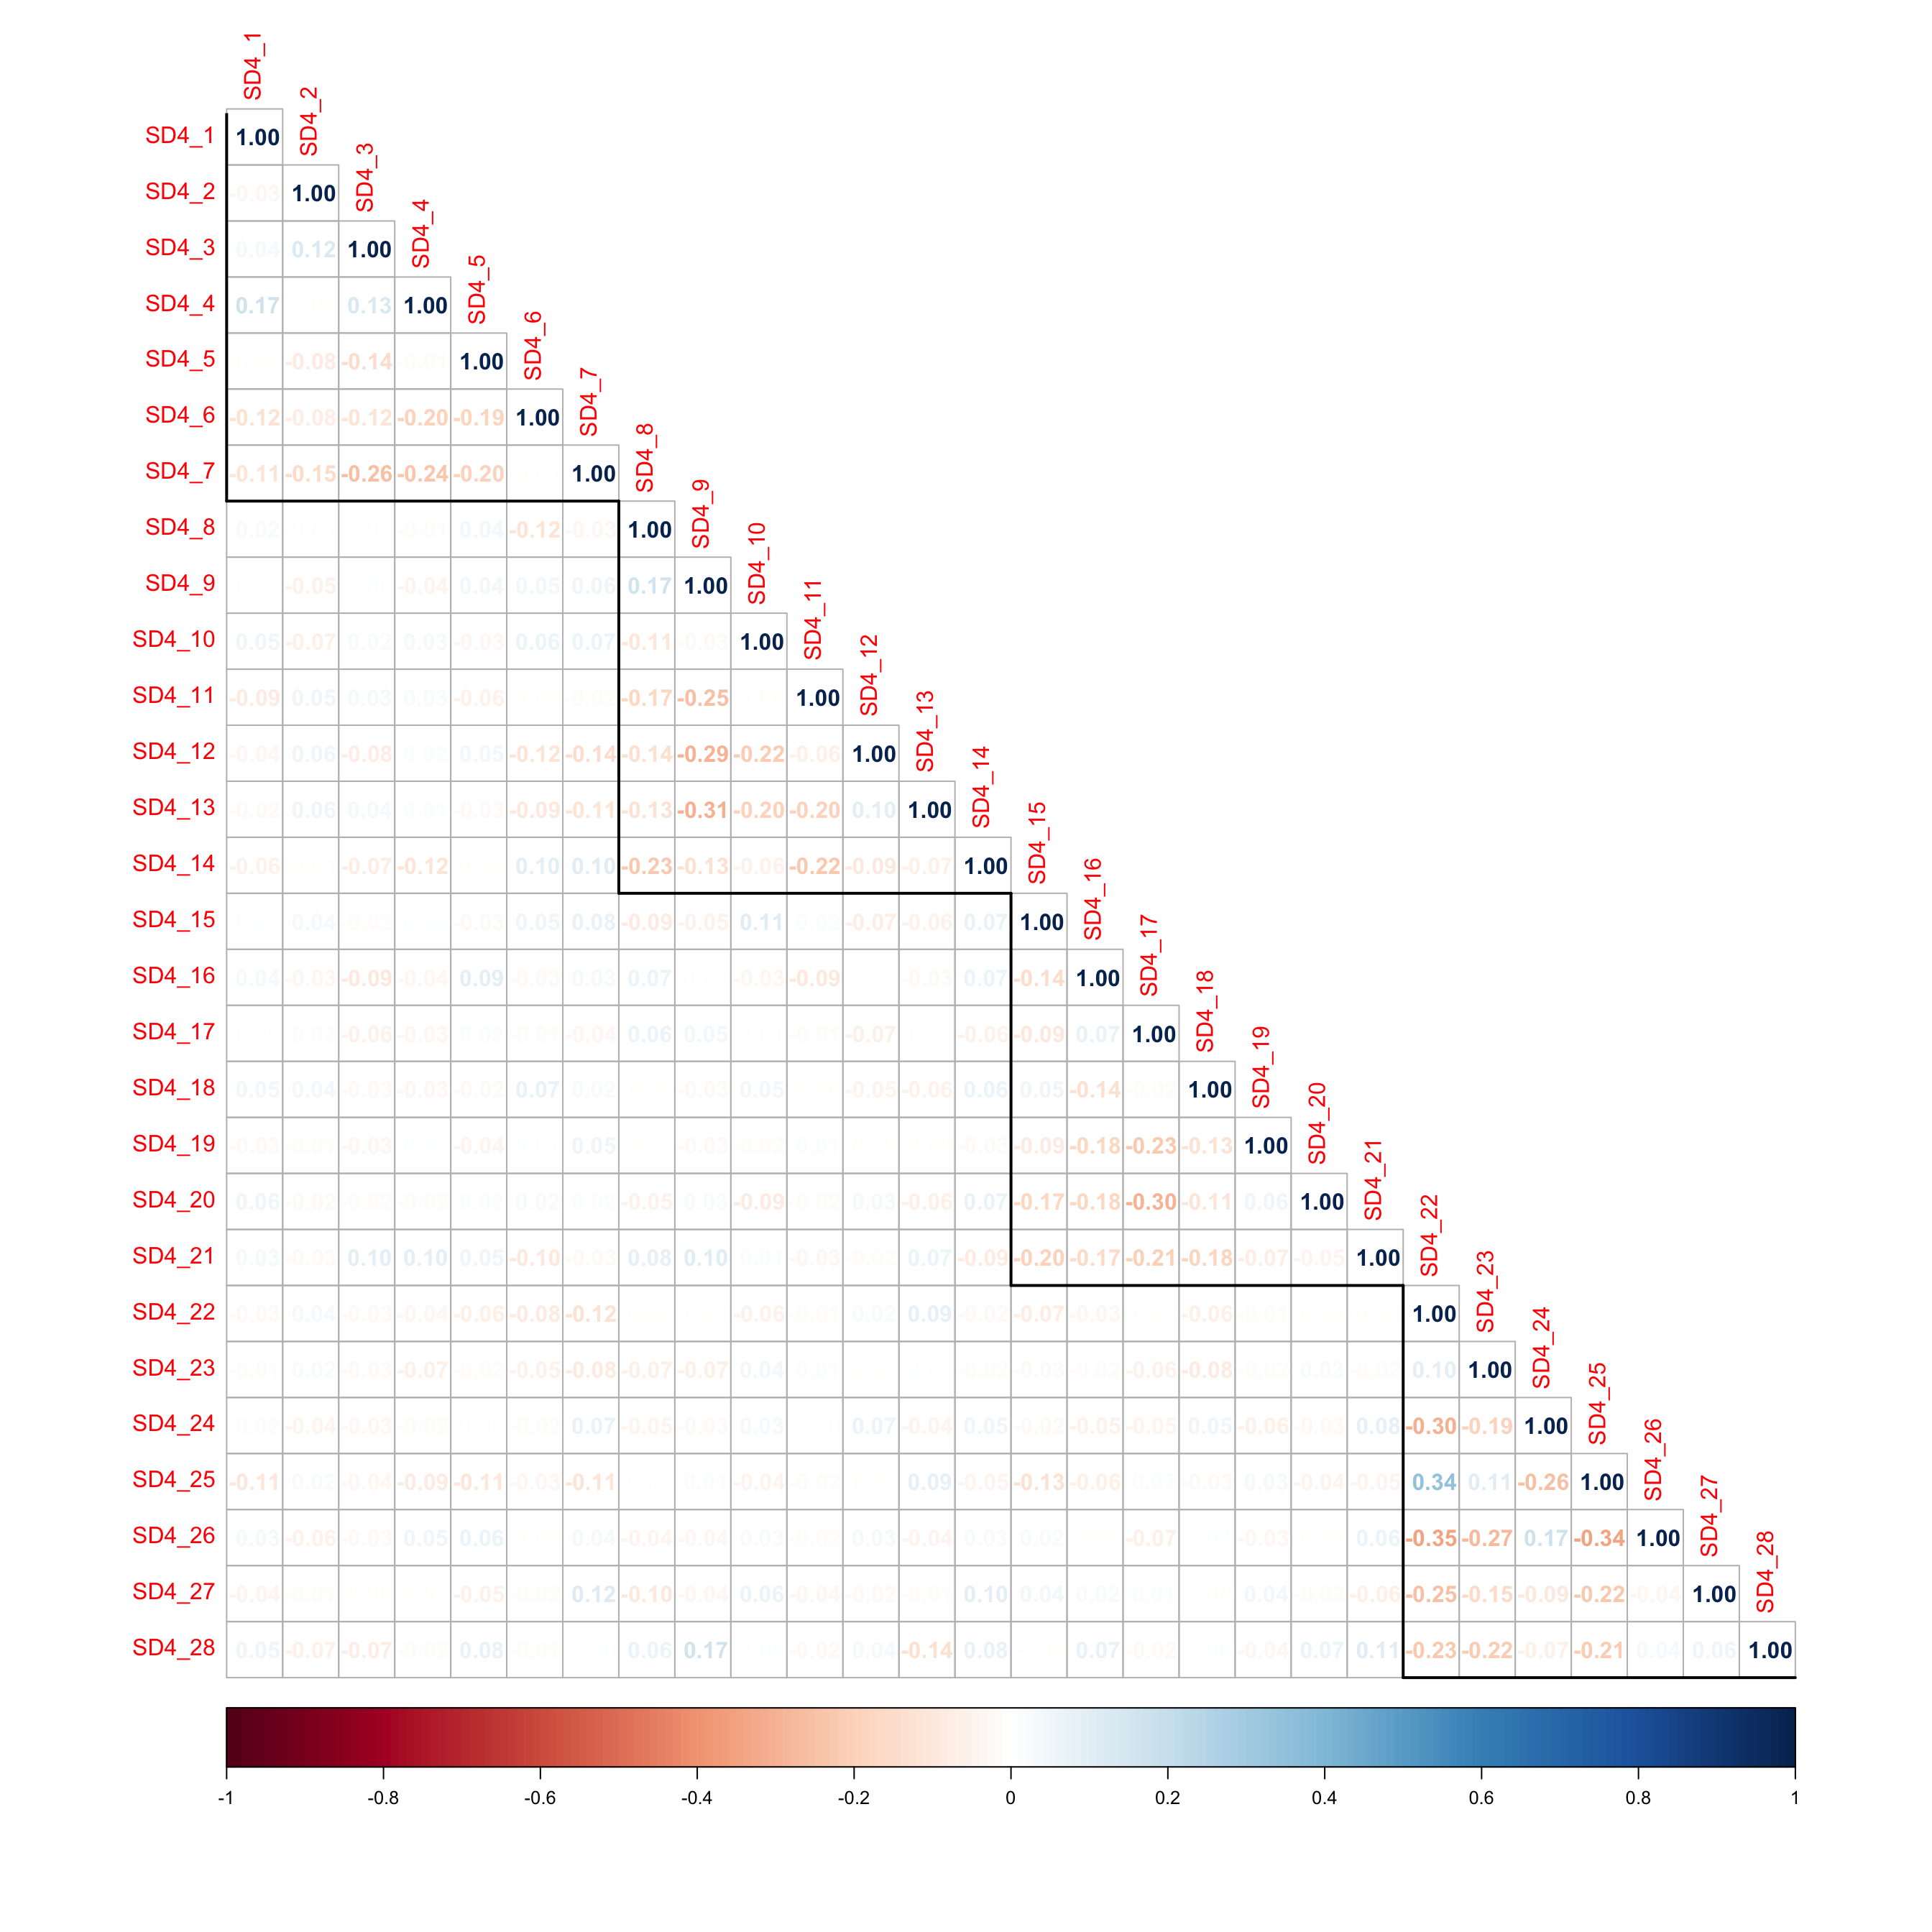
Summary
Machiavellianism. Items 1 and 2 show weak discrimination relative to their target factor, falling below conventional cut-offs, and both were flagged by the polychoric correlations. Compared to the other Machiavellianism items, Items 1 and 2 describe more general-purpose behaviours than outright manipulation. Item 7, although not flagged by the item fit statistics, shows large negative residuals with other Machiavellianism items, consistent with Guilhermino et al.’s (2026) repositioning of Item 7 as a Sadism indicator.
Narcissism. Items 12 and 13 generate localised strain in the model, flagged by both item fit and residual diagnostics. Item 11 shows a related pattern in the residuals, though it does not reach significance under item fit. All three share the same grandiose, superiority-laden content (e.g., “special,” “exceptional,” “future star”) that set them apart from the more normative Narcissism items discussed above. Unlike Items 1 and 2, whose problem is weak discrimination, Items 11, 12, and 13 discriminate reasonably well (a = 1.800, 1.484, 1.554) but do not sit comfortably within a single Narcissism factor, suggesting they may share variance of their own.
Psychopathy. Item 21 is flagged by item fit and residual diagnostics; Item 20 is flagged by residuals alone. Content-wise, both items stray from the themes captured by the other five items. Item 20 (I sometimes get into dangerous situations) is concerned with self-directed risk-taking, whilst Item 21 (People who mess with me always regret it) is about retaliatory threats. Items 15-19, in comparison, are concerned with rule-breaking, confrontations, or legal trouble. Guilhermino et al. (2026) report Item 21 aligning with the Sadism factor in their network analytic approach.
Sadism. Items 22, 26, and 28 show strain across both item fit and residual diagnostics; Item 23 is flagged by item fit alone, and Item 25 by residuals alone. Content-wise, the flagged items span more than one kind of construct: Items 22 and 25 describe vicarious enjoyment of others’ aggression, while Item 28 describes active, direct verbal harm. Item 26 (Some people deserve to suffer) is different again. It is a moral or attitudinal justification rather than a report of enjoyment or behaviour. This content heterogeneity may account for some of the mixed-sign residual pattern, and is broadly consistent with Guilhermino et al.’s (2026) own decision to split Sadism into vicarious and direct subdimensions.
Synthesis
Crawford et al. (2025) represent a fourth independent investigation of the SD4, this time in a predominantly British sample. Confirmatory factor analysis found the original four-factor model to be a poor fit (\(\chi^2 (344) = 992.08\), \(p < .001\), \(CFI = 0.823\), \(TLI = 0.806\), \(RMSEA = 0.058\) \([95\%\text{ CI: } 0.052, 0.060]\), \(SRMR = 0.063\)). Following inspection of residual matrices, Crawford et al. proposed an alternative five-factor model: Items 5, 6, and 7 were dropped from Machiavellianism, Items 8 and 9 from Narcissism, and Item 27 from Sadism; Psychopathy remained untouched. Sadism was again split in two, as in Guilhermino et al. (2026). Interestingly, Crawford’s Violent Voyeurism factor (Items 22, 23, 25) is an exact item-for-item match with Guilhermino’s Vicarious Sadism. Yet even here the agreement is partial: Crawford’s second sadism factor, Indirect Sadism, retains Items 24, 26, and 28, while Guilhermino’s Direct Sadism additionally retains Item 27. This means the one point of clearest cross-study convergence in the SD4 literature still contains a disagreement about where a single item belongs.
Four independent teams, across four countries and using four distinct analytic approaches (CFA with parcelling, network psychometrics, IRT, and residual-based CFA respecification) have each proposed a different structural fix for the SD4. Not one has proposed revising the wording of a weak item.
It is not just about this singular scale; it reflects a pattern across psychometrics more broadly. Scales are developed rapidly, published with claims of validity and reliability, often on the back of questionable practices (parcelling, EFA-then-CFA circularity, post-hoc item reassignment). Once published, papers tend to take one of two paths: assume the scale is valid and use it to collect and analyse data, or attempt to re-validate it using a different method. Both are problematic. The first assumes the scale measures what it claims to, without interrogating whether that assumption holds. Can we trust the findings of any paper built on such a scale, or are we simply extending a long trajectory of research built on shaky foundations? The second path doesn’t fare much better: it treats the model’s structure as the problem to be solved, rather than the items themselves. Splitting factors, dropping items, and proposing alternative representations have done little to fix anything. Instead, these actions have muddied the waters as to what the optimal model even is. The data, across four independent studies now, keeps pointing to the same handful of items failing to load or hang together effectively. Yet the response has consistently been to rework the structure around them, rather than revise the items causing the strain.