# Libraries ---------------------------
library(data.table)
library(flextable)
library(lavaan)
library(mirt)
library(psych)
library(readxl)
library(TAM)

# Read Data ---------------------------
feedback_scale <-
  read_xlsx("feedback_literacy_cleaned_rasch_scores.xlsx") |>
as.data.table()Overview
When writing items for any psychometric test, we need to be mindful of social desirability. This occurs when an item is written in such a way that only an extreme response–positive or negative–will be given by the respondent (e.g., I believe volunteer work makes a positive difference). It is problematic because it limits our ability to differentiate individuals based on their response patterns, reducing any potential insights we can extract. The better alternative is to write behaviourally-anchored items (e.g., I undertake voluntary work in my free time). Because these are tied to a specific behaviour, responses are more likely to be variable.
In this post, we examine a recently published Feedback Literacy scale by Woitt et al. Feedback literacy broadly refers to a student’s capacity to understand, evaluate, and act on feedback — an increasingly prominent construct in educational psychology. The authors undertook several initial validation steps to arrive at a factor solution grounded in the literature. However, an inspection of the scale items reveals a number of item-writing issues. As the data is openly available, we can analyse it directly to see whether the results align with what the authors reported.
| No. | Item |
|---|---|
| 1 | I think that a feedback process is most effective, if I take an active role in it. |
| 2 | I believe that I can contribute to the value of feedback processes. |
| 3 | I feel that I have a responsibility for using feedback to improve academically. |
| 4 | I believe that one of the main purposes of feedback is for me to improve in my studies. |
| 5 | I feel that feedback helps me refine my judgments on my own work. |
| 6 | I believe that feedback can come in various forms and from various sources. |
| 7 | I welcome feedback despite the feelings it might trigger. |
| 8 | I am interested in receiving feedback about my learning. |
| 9 | I am determined to make use of feedback for improving in my studies. |
| 10 | I am ready to engage with feedback and make changes accordingly. |
| 11 | I am willing to invest effort and energy into making use of feedback. |
| 12 | I tend to avoid engaging with unpleasant feedback. |
| 13 | I take into account whether a feedback source seems reliable. |
| 14 | When evaluating feedback, I keep in mind that there are different perspectives and opinions. |
| 15 | I make a conscious choice of what feedback to accept or dismiss. |
| 16 | When faced with feedback, I tell myself that it is potentially useful. |
| 17 | If needed, I seek out further information to better understand a feedback comment. |
| 18 | When I receive feedback, I usually know why it was given to me and what it is good for. |
| 19 | When dealing with feedback, I try to keep my emotional balance. |
| 20 | I handle feedback on a factual level instead of taking it personally. |
| 21 | I draw conclusions from feedback about myself as a person. |
| 22 | I really take my time to reflect on feedback I have received. |
| 23 | I document feedback information so that I can come back to it later. |
| 24 | I always read, listen to or watch feedback that I am given. |
| 25 | I assess my learning progress to determine where feedback might be helpful to me. |
| 26 | I proactively ask for feedback instead of waiting to be provided with it. |
| 27 | I take into account multiple sources of feedback because they are useful in different ways. |
| 28 | I keep an eye out for feedback that might be given implicitly. |
| 29 | Based on what I learn from feedback, I consider doing things differently in the future. |
| 30 | I reconsider and refine my learning strategies based on feedback. |
| 31 | I adjust my learning goals based on feedback. |
| 32 | I stick to my learning strategies despite the feedback I receive. |
| 33 | I put the insights I gain from feedback into action. |
| 34 | I strive to make the most of the feedback I have received. |
| 35 | If given the opportunity, I revise my work based on feedback. |
| 36 | When receiving feedback, I can think of different ways for making good use of it. |
| 37 | I am most often clueless about what to do with feedback I am provided with. |
| 38 | I refer to my previous feedback experiences for judging my overall progress. |
| 39 | I take insights from a range of feedback experiences for the purpose of continuous improvement. |
| 40 | I take feedback into account for evaluating how well I am navigating a challenge. |
| 41 | I welcome feedback that can help me gain orientation when I struggle with my learning. |
Item Analysis
We begin with an item analysis by examining the mean and standard deviation of each item. Because these are attitudinal Likert items rather than scored for correctness, item difficulty is better conceptualised as endorsement rate. Items that are easy to endorse will tend to have high mean values and small standard deviations (e.g., SD < 1), indicating that most respondents agree and that there is little variation in responses. This pattern is consistent with ceiling effects. In practice, items that discriminate well tend to have means closer to the midpoint and relatively large standard deviations, reflecting meaningful variation in endorsement.
# Item Analysis -----------------------
feedback_scale[, .(
  `Item ID` = names(.SD),
  Mean = apply(.SD, 2, function (x)
    mean(x, na.rm = T)),
  SD = apply(.SD, 2, function (x)
    sd(x, na.rm = T))
), .SDcols = patterns("^FL")] |>
  as_flextable(max_row = 41, show_coltype = F) |>
  align_nottext_col(align = "center") |>
colformat_double(digits = 3)Item ID | Mean | SD |
|---|---|---|
FL01 | 4.167 | 0.896 |
FL02 | 3.905 | 0.650 |
FL03 | 4.136 | 0.780 |
FL04 | 4.217 | 0.791 |
FL05 | 4.100 | 0.831 |
FL06 | 4.113 | 0.668 |
FL07 | 3.507 | 0.887 |
FL08 | 4.109 | 0.796 |
FL09 | 4.104 | 0.656 |
FL10 | 4.050 | 0.721 |
FL11 | 4.063 | 0.736 |
FL12 | 2.950 | 1.067 |
FL13 | 4.222 | 0.815 |
FL14 | 4.154 | 0.759 |
FL15 | 3.959 | 0.683 |
FL16 | 3.964 | 0.624 |
FL17 | 4.009 | 0.757 |
FL18 | 3.828 | 0.712 |
FL19 | 3.679 | 0.769 |
FL20 | 3.792 | 0.821 |
FL21 | 3.991 | 0.775 |
FL22 | 3.656 | 0.825 |
FL23 | 3.624 | 0.939 |
FL24 | 3.706 | 0.820 |
FL25 | 3.878 | 0.731 |
FL26 | 3.222 | 0.954 |
FL27 | 4.122 | 0.768 |
FL28 | 3.882 | 0.855 |
FL29 | 3.769 | 0.790 |
FL30 | 3.973 | 0.646 |
FL31 | 3.891 | 0.686 |
FL32 | 2.973 | 1.095 |
FL33 | 3.842 | 0.731 |
FL34 | 3.751 | 0.778 |
FL35 | 3.688 | 0.830 |
FL36 | 4.009 | 0.647 |
FL37 | 2.593 | 1.056 |
FL38 | 3.995 | 0.599 |
FL39 | 3.991 | 0.603 |
FL40 | 4.032 | 0.663 |
FL41 | 4.005 | 0.723 |
n: 41 | ||
Table 1 presents the mean and standard deviations for all 41 items. The majority of items show high average endorsement, with several displaying limited variability. Approximately 39.024% (16/41) of items have a mean of 4 or above and a standard deviation below 1, consistent with strong ceiling effects. When responses of 4 or 5 are considered together, 61% (N = 25/41) of items have at least 80% of responses in these categories; this rises to 80.5% (N = 33/41) using a 70% threshold.
A small number of items (FL07, FL12, FL19, FL20) show lower endorsement rates and greater variability. Comparing two items helps illustrate why such differences may emerge:
I believe that one of the main purposes of feedback is for me to improve in my studies (FL04).
I welcome feedback despite the feelings it might trigger (FL07).
FL04 is a universal belief about the purpose of feedback. Strong agreement with such an item is socially desirable, making high endorsement an inevitability. By contrast, FL07 requires endorsement in the face of potential discomfort. Although agreement remains normatively valued, it is more demanding and less universally guaranteed, resulting in lower endorsement and greater dispersion.
Having items like FL04 are self-limiting. Little variation on account of high endorsement reduces one’s ability to differentiate between respondents. This will affect dimensionality and factor solutions.
We next explore how the items relate to one another. Calculating polychoric correlations on the full item set returns a non-positive definite matrix. This points to a fundamental problem in the data — an absence of variation, high intercorrelations, or both — that will undermine the factor analysis before it has even begun.
tryCatch(
  {
    pc <- polychoric(feedback_scale[, .SD, .SDcols = patterns("^FL")])
    print(pc)
  },
  warning = function (x) {
    message(conditionMessage(x))
  })
Matrix was not positive definite, smoothing was doneGiven this, a decision was made to drop non-informative items – those with a mean of 4 or above and a standard deviation of 0.70 or below.
items_to_drop <-
  feedback_scale[, .(
    `Item ID` = names(.SD),
    Mean = round(apply(.SD, 2, function (x)
      mean(x, na.rm = T)), 1),
    SD = round(apply(.SD, 2, function (x)
      sd(x, na.rm = T)), 1)
  ), .SDcols = patterns("^FL")][Mean >= 4 & SD <= .7, `Item ID`]

feedback_scale[, c(items_to_drop) := NULL]
This resulted in 12 items being removed, leaving 29 items for further analysis. With these items removed (FL06, FL09, FL10, FL11, FL15, FL16, FL30, FL36, FL38, FL39, FL40, and FL41), the correlation are calculated without error.
tryCatch(
  {
    pc <- polychoric(feedback_scale[, .SD, .SDcols = patterns("^FL")])
  },
  warning = function (x) {
    message(conditionMessage(x))
  })
From the resulting correlation plot, we can see relatively few strong correlations among items. This raises questions as to whether the paper’s two-factor claim is supported by the data. Items FL12, FL26, FL32, and FL37 show particularly weak correlations with the rest of the scale, which is worth investigating further. On wording alone, these items are a mix of negatively worded and poorly constructed – and notably, they are also the items with the highest variability relative to the rest of the scale. The fact that the original authors removed the same items, though on statistical rather than substantive grounds, suggests these problems did not go entirely undetected.
corrplot::corrplot(pc$rho, type = "lower")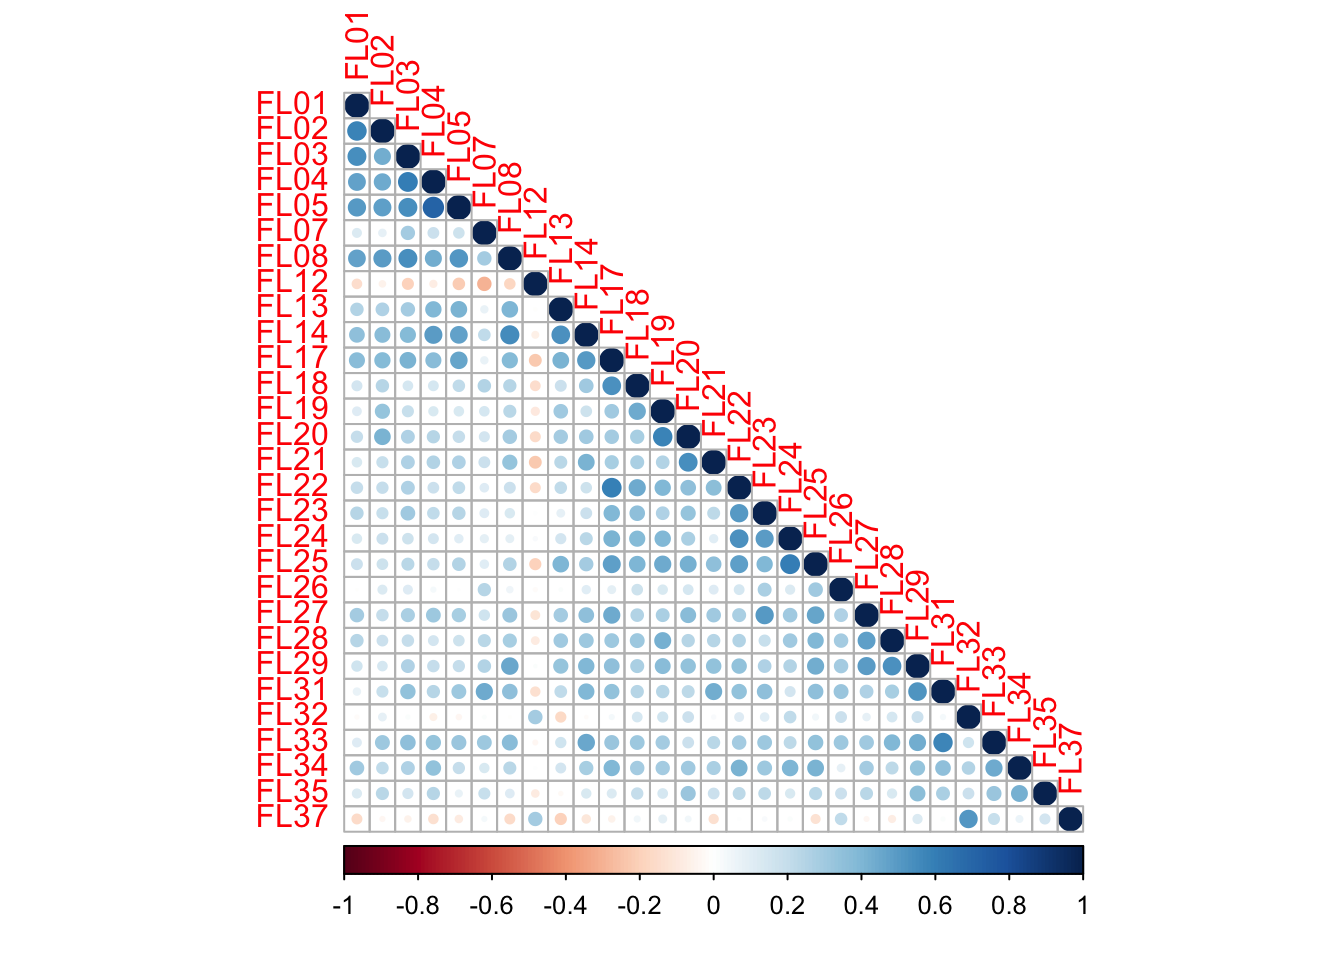
Factor Analysis
Running an exploratory factor analysis (EFA) on the remaining 29 items –testing solutions from one to five factor solutions– we find that none of the models are identified. This is a direct consequence of the item-writing problems already identified — when too many items cluster at the ceiling and share little meaningful variance, the data simply cannot support a stable factor solution.
tryCatch(
  {
    efa_mods <- efa(feedback_scale[, .SD, .SDcols = patterns("^FL")], nfactors = 1:5, ordered = T)
  },
  warning = function (x) {
    message(conditionMessage(x))
  })
lavaan->lav_model_vcov():
The variance-covariance matrix of the estimated parameters (vcov) does not
appear to be positive definite! The smallest eigenvalue (= -2.671569e-17)
is smaller than zero. This may be a symptom that the model is not
identified.Item Response Theory
An exploratory two-factor graded response model fitted using MIRT fails to converge, most likely due to the combination of sample size and item quality issues identified above.
twof_graded_model <- mirt(feedback_scale[, .SD, .SDcols = patterns("^FL")], model = 2, itemtype = "graded")Warning: EM cycles terminated after 500 iterations.M2(twof_graded_model) M2 df p RMSEA RMSEA_5 RMSEA_95 SRMSR
stats 479.1752 262 6.328271e-15 0.0613823 0.05251362 0.06985089 0.07622676
TLI CFI
stats 0.7515266 0.7959247If we set aside the convergence warning and inspect the fit anyway, the results fall well below acceptable thresholds — RMSEA of 0.061, SRMSR of 0.076, CFI of 0.796, and TLI of 0.752.
Stepping back to a one-factor model, convergence is achieved without error, but fit remains poor — RMSEA of 0.070, SRMSR of 0.098, CFI of 0.704, and TLI of 0.674.
onef_graded_model <- mirt(feedback_scale[, .SD, .SDcols = patterns("^FL")], model = 1, itemtype = "graded")M2(onef_graded_model) M2 df p RMSEA RMSEA_5 RMSEA_95 SRMSR TLI
stats 605.2035 290 0 0.07028865 0.06226647 0.07797672 0.09802517 0.6741904
CFI
stats 0.7038094At this point the appropriate recommendation would be to retain the 29 items, undertake systematic rewrites, and run a new data collection before attempting further validation. The item-writing problems are directly undermining model estimation, and the sample size is insufficient to recover from them.
Setting that aside and pressing on with the unidimensional model, we can inspect the item parameters, with the caveat that given N = 221, all estimates carry meaningful uncertainty.
Looking at item discrimination, seven items fall below an absolute value of 1, indicating weak relationships with the latent trait:
I think that a feedback process is most effective, if I take an active role in it (FL01).
I welcome feedback despite the feelings it might trigger (FL07).
I tend to avoid engaging with unpleasant feedback (FL12).
I proactively ask for feedback instead of waiting to be provided with it (FL26).
I stick to my learning strategies despite the feedback I receive (FL32).
If given the opportunity, I revise my work based on feedback (FL35).
I am most often clueless about what to do with feedback I am provided with (FL37).
FL01 is ambiguously worded, “active role in feedback” is unlikely to mean the same thing to all respondents, and the item has a minor grammatical issue. FL07 loads weakly and has wide thresholds, suggesting estimation instability. FL12 shows large threshold values, consistent with low response variance — respondents may not have a clear referent for “unpleasant feedback.” FL26 and FL35 are difficult items with high upper thresholds, though here too estimation uncertainty is a concern; both show weak discrimination regardless. FL37 is the most problematic: a discrimination value of -0.085 and threshold values ranging from -34 to 26 are nonsensical, indicating the item has essentially no meaningful relationship with the latent trait and is actively destabilising estimation.
Turning to item thresholds more broadly, the pattern established in the descriptive statistics continues. Most items have strongly negative lower thresholds, reflecting how easy they are to endorse, and the upper thresholds for many items remain low on the latent scale — meaning even modest levels of the underlying trait are sufficient for full endorsement. This is the IRT expression of the ceiling effects identified earlier.
coef(onef_graded_model, simplify = T, IRTpars = T)$items |>
  as.data.table(keep.rownames = "Item ID") |>
  as_flextable(max_row = 29, show_coltype = F) |>
  align_nottext_col(align = "center") |>
  colformat_double(digits = 3)
Item ID | a | b1 | b2 | b3 | b4 |
|---|---|---|---|---|---|
FL01 | 0.952 | -4.161 | -3.378 | -2.438 | 0.626 |
FL02 | 1.078 | -4.566 | -3.400 | -1.989 | 2.371 |
FL03 | 1.290 | -4.131 | -2.907 | -1.969 | 0.786 |
FL04 | 1.234 | -4.286 | -3.227 | -1.992 | 0.499 |
FL05 | 1.305 | -4.159 | -2.892 | -1.645 | 0.701 |
FL07 | 0.696 | -8.129 | -2.903 | -0.089 | 2.996 |
FL08 | 1.337 | -3.737 | -2.932 | -1.743 | 0.819 |
FL12 | -0.342 | 7.359 | 1.326 | -1.818 | -8.492 |
FL13 | 1.025 | -4.579 | -3.672 | -2.413 | 0.528 |
FL14 | 1.454 | -3.547 | -3.007 | -1.857 | 0.748 |
FL17 | 1.757 | -3.606 | -2.367 | -1.390 | 1.058 |
FL18 | 1.146 | -4.106 | -3.140 | -1.393 | 2.294 |
FL19 | 1.182 | -4.710 | -2.584 | -0.625 | 2.215 |
FL20 | 1.246 | -4.206 | -2.442 | -0.997 | 1.704 |
FL21 | 1.229 | -3.869 | -2.633 | -1.939 | 1.409 |
FL22 | 1.522 | -3.674 | -1.846 | -0.552 | 1.845 |
FL23 | 1.158 | -4.034 | -1.801 | -0.713 | 1.902 |
FL24 | 1.091 | -4.576 | -2.392 | -0.942 | 2.273 |
FL25 | 1.598 | -3.212 | -2.528 | -1.362 | 1.684 |
FL26 | 0.566 | -5.878 | -2.438 | 0.653 | 4.849 |
FL27 | 1.406 | -3.845 | -2.879 | -1.837 | 0.804 |
FL28 | 1.247 | -4.008 | -2.328 | -1.320 | 1.412 |
FL29 | 1.580 | -4.070 | -2.120 | -0.773 | 1.575 |
FL31 | 1.431 | -4.714 | -2.564 | -1.333 | 1.737 |
FL32 | 0.280 | -8.576 | -1.938 | 1.805 | 9.678 |
FL33 | 1.496 | -3.818 | -2.811 | -0.952 | 1.610 |
FL34 | 1.305 | -3.876 | -2.627 | -0.857 | 1.950 |
FL35 | 0.711 | -5.168 | -3.697 | -1.401 | 3.489 |
FL37 | -0.085 | 26.051 | -4.540 | -14.064 | -34.973 |
n: 29 | |||||
At this point it is clear that this exercise should have remained at the pilot stage. The item wording falls short of acceptable standards, and claiming a factor solution from these data is little more than a fishing exercise that has capitalised on chance. Psychometric scale developed is an iterative process. There is no guarantee that items will hang together in a hypothesised factor structure, and initial development work exists precisely to identify weak items and understand how to improve them before ceiling effects and estimation failures take hold.
As a final step, we test the model the authors presented as validated. Rather than modelling each factor separately, which contradicts the hypothesised structure, we model both factors simultaneously using a two-factor Generalised Partial Credit Model (GPCM) fitted in TAM, with item-factor assignments specified according to the authors’ published structure.
feedback_scale <-
  read_xlsx("feedback_literacy_cleaned_rasch_scores.xlsx") |>
  as.data.table()

retained_items <- c("FL01", "FL02", "FL03", "FL04", "FL05", "FL06", "FL08", "FL09", "FL14", "FL17", "FL19", "FL20", "FL22", "FL25", "FL27", "FL29", "FL30", "FL34", "FL35", "FL38", "FL40")

feedback_scale <- feedback_scale[, .SD, .SDcols = retained_items]
q_matrix <-
matrix(
c(
1,0,
1,0,
1,0,
1,0,
1,0,
1,0,
1,0,
1,0,
1,0,
0,1,
0,1,
0,1,
0,1,
0,1,
0,1,
0,1,
0,1,
0,1,
0,1,
0,1,
0,1
),
ncol = 2,
byrow = T
)
gpcm_2f_mod <-
tam.mml(
feedback_scale,
irtmodel = "GPCM",
Q = q_matrix
)The model converges. The two-factors correlate moderately (r = 0.595) with EAP reliabilities of 0.847 and 0.837. However, inspection of the item thresholds confirms the same pattern seen throughout: all items are relatively easy to endorse, with threshold values clustered at the lower end of the latent scale. FL09 is additionally noteworthy for showing a disordered threshold — categories 1 and 2 are effectively indistinguishable for this item.
tam.threshold(gpcm_2f_mod) |>
  as.data.table(keep.rownames = "Item ID") |>
  as_flextable(max_row = 21, show_coltype = F) |>
  align_nottext_col(align = "center") |>
  colformat_double(digits = 3)
Item ID | Cat1 | Cat2 | Cat3 | Cat4 | Cat5 |
|---|---|---|---|---|---|
FL01 | -12.000 | -2.867 | -2.415 | -2.046 | 0.599 |
FL02 | -12.000 | -3.690 | -2.880 | -2.107 | 2.861 |
FL03 | -12.000 | -3.719 | -2.746 | -2.200 | 1.019 |
FL04 | -12.000 | -3.641 | -2.920 | -2.229 | 0.575 |
FL05 | -12.000 | -3.784 | -2.738 | -1.878 | 0.905 |
FL06 | -12.000 | -4.785 | -3.126 | -2.464 | 1.463 |
FL08 | -12.000 | -3.380 | -2.810 | -2.102 | 1.067 |
FL09 | -12.000 | -12.000 | -3.638 | -2.311 | 1.414 |
FL14 | -12.000 | -3.298 | -2.941 | -2.344 | 1.023 |
FL17 | -12.000 | -3.344 | -2.346 | -1.733 | 1.496 |
FL19 | -12.000 | -3.941 | -2.387 | -0.717 | 2.401 |
FL20 | -12.000 | -3.570 | -2.132 | -1.044 | 1.919 |
FL22 | -12.000 | -3.676 | -2.007 | -0.719 | 2.349 |
FL25 | -12.000 | -2.822 | -2.300 | -1.611 | 2.320 |
FL27 | -12.000 | -3.255 | -2.462 | -1.884 | 0.987 |
FL29 | -12.000 | -3.981 | -2.244 | -0.994 | 2.087 |
FL30 | -12.000 | -3.118 | -2.854 | -1.954 | 2.055 |
FL34 | -12.000 | -3.152 | -2.344 | -1.003 | 2.283 |
FL35 | -12.000 | -2.672 | -1.988 | -0.962 | 2.575 |
FL38 | -12.000 | -3.505 | -2.792 | -2.176 | 2.213 |
FL40 | -12.000 | -3.622 | -2.591 | -2.050 | 1.760 |
n: 21 | |||||
The item locations range from ξ=-7.92 to ξ=-12.06, indicating that the scale as a whole targets respondents at the lower end of the feedback literacy continuum. In practice, the scale is composed almost entirely of socially desirable items that cluster at the same point on the trait spectrum — meaning it cannot meaningfully differentiate among respondents with moderate to high feedback literacy. The Wright Map illustrates this clearly.
IRT.WrightMap(gpcm_2f_mod)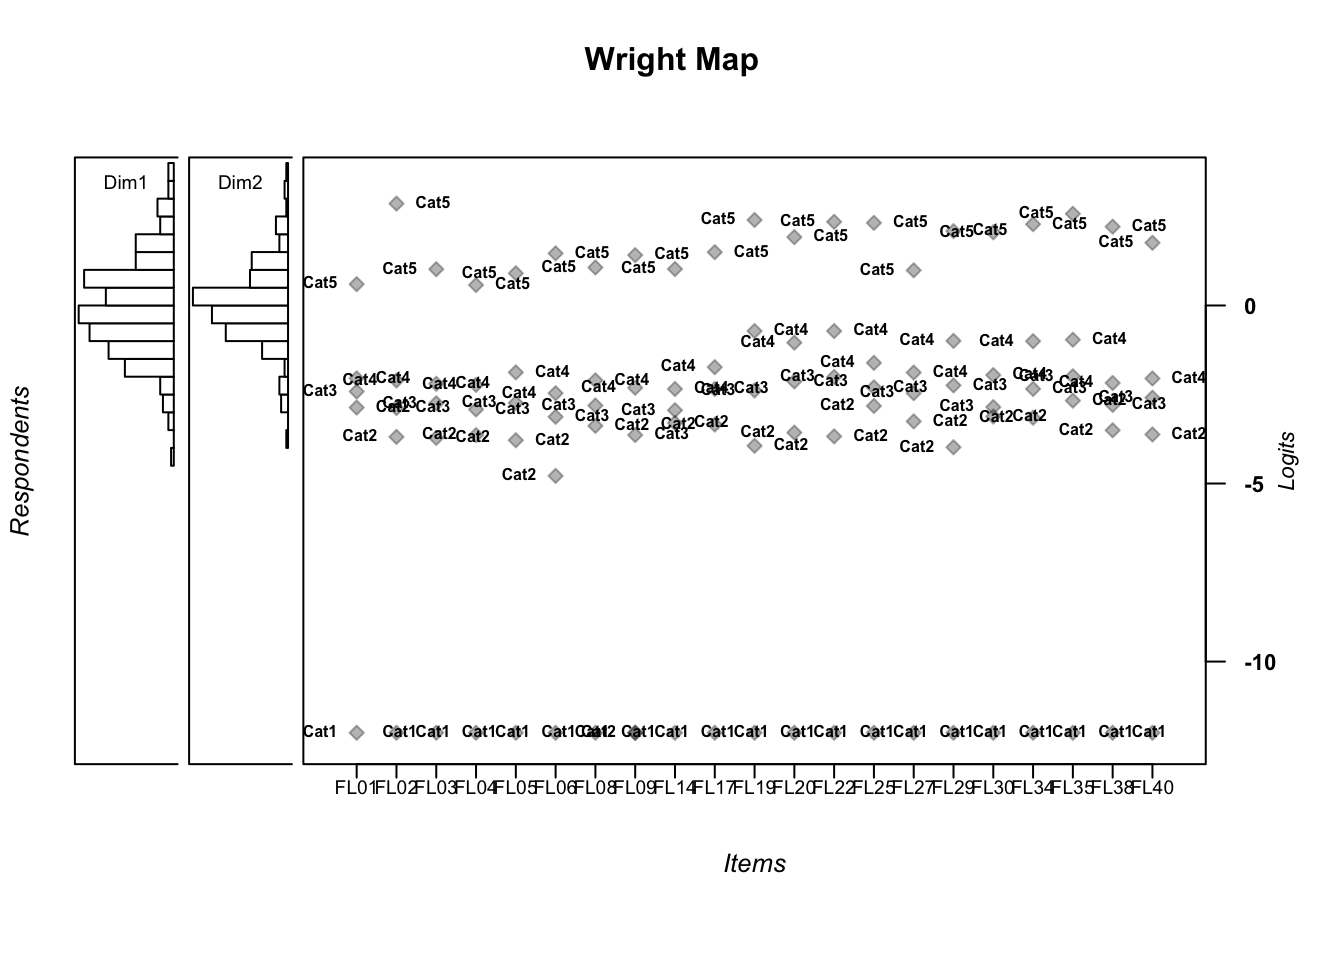
It is possible that through the various analytical decisions the authors made, they arrived at a permissible factor structure in a narrow technical sense. But the items themselves introduce systemic problems that no amount of post-hoc pruning can resolve.
A final observation on the 21 retained items: calculating the average longest string of identical consecutive responses gives a value of ~7, with a mean intra-individual response variability of ~0.61. This is prior to accounting for reverse scoring, so the true extent of response homogeneity may be higher. The pattern is consistent with widespread acquiescence — respondents agreeing broadly across the board, even when not selecting the maximum response category.
Conclusion
Throughout this post, we have seen consistently that socially desirable attitudinal items produce ceiling effects, with downstream consequences for statistical analyses including EFA and MIRT. When the authors’ 21-item structure is tested properly — modelling both factors simultaneously — it converges, but produces a scale that targets only those at the lower end of the feedback literacy continuum, and cannot differentiate among respondents with moderate to high levels of the trait. This is a direct consequence of decisions made at the item-writing stage.
The scale is not beyond rescue. Feedback literacy is a meaningful construct with genuine value in educational research. But salvaging this instrument requires investment beyond minor rewrites. Attitudinal items dominate the scale, and these need to be replaced with behaviourally-anchored equivalents capable of producing meaningful response variability. An item like “I believe that one of the main purposes of feedback is for me to improve my studies” will reliably produce a ceiling effect in any student population — agreement is near-universal precisely because the item asks about a belief rather than a behaviour. Asking instead what an individual actually does with feedback, and under what conditions, substantially increases the likelihood of discriminating among respondents in a psychometrically useful way.