# Libraries ------------------------

library(data.table)
library(ggplot2)
library(janitor)
library(knitr)
library(scales)
library(stringr)

# Read Data ------------------------

lms_engagement <-
  fread("data/Activity_tracking_sheet.csv")

# Clean Column Names ---------------

lms_engagement <-
clean_names(lms_engagement)I have worked in Learning Analytics for several years, both in academic and professional settings, primarily utilising Learning Management System (LMS) data. In academic settings, I built university-wide reports on student engagement on a weekly basis. In a professional context, the data was used to monitor engagement with mandatory courses. In both cases, the level of engagement with learning content is heavily dependent on good design—limited content leads to less engagement.
Learning Analytics can also highlight significant issues. Despite the time and resources dedicated to developing professional courses, engagement may still be limited. Additionally, data often reveals that many individuals quickly skim through the content just to mark it as complete, rather than thoroughly digesting the material.
In this post, I will illustrate how LMS data can offer rich insights into engagement with learning materials. The data I will be using was sourced from Kaggle.
Data
The data originates from an EdTech startup. The platform is designed to teach 6 to 14-year-olds Entrepreneurial Life-Skills (e.g., communication, problem-solving skills). It seems to be a niche market.
The dataset contains anonymised contact information using synthetic data (based on the Kaggle description). Our focus is on the 17 columns referring to each of the learning activities (Tutorials, Exercises, Quizzes, Summaries, and Feedback). The values for these columns can be a status of Completed (along with the time of completion) or Not Completed (Table 1).
kable(lms_engagement[1, 6:10])| introduction | activity_know_your_personality_a_fun_way | a_simple_quiz_on_the_previous_video | lets_see_what_product_is | a_simple_quiz_on_the_previous_video_2 |
|---|---|---|---|---|
| Completed Monday, 14 November 2016, 11:36 AM | Completed Monday, 14 November 2016, 11:53 AM | Completed (achieved pass grade) Monday, 14 November 2016, 11:55 AM | Completed Monday, 14 November 2016, 11:56 AM | Completed Monday, 14 November 2016, 12:35 PM |
Course Completions
# Course Completions -----------------

lms_engagement_binary <-
  lms_engagement[, lapply(.SD, function(x)
    ifelse(grepl("^Completed", x), 1, ifelse(grepl("^Not", x), 0, x)))]

# Completion Rate --------------------

percentage_completed <-
  apply(lms_engagement_binary[, c(6:22)], 1, function(x) mean(as.numeric(x)))
Knowing how many individuals complete a course is considered the most important metric, particularly in regards to return on investment. In this data, we find that individuals complete 20.04% of the course, on average, and only 9.38% completed the course itself.
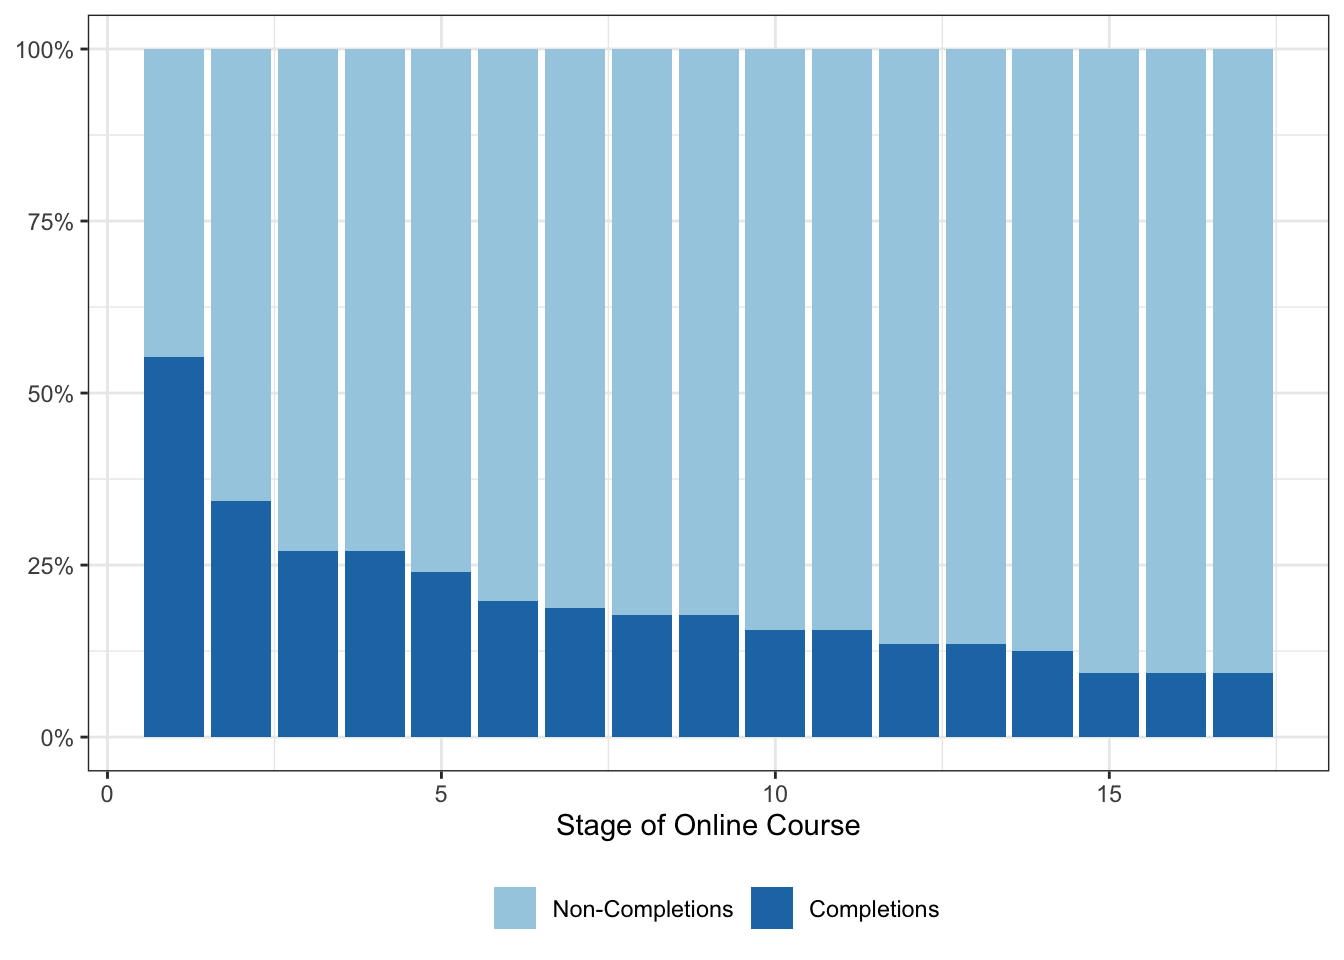
Most individuals aren’t making it through 25% of the course, let alone completing the course. Perhaps there’s a point during the course at which we see a non-neglible drop-off. This could signify a problem with the course design that puts individuals off from continuing.
Figure 1 illustrates the proportion of individuals (N = 96) completing each section of the online course. Even from the outset, a little over 50% complete the first activity. After this point, there is a decline at each step until it levels off to around 10%.
# Drop Off Points ------------------

prp_progression_completion <-
  apply(lms_engagement_binary[, c(6:22)], 2, function(x)
    mean(as.numeric(x)))

count_progression_completion <-
  apply(lms_engagement_binary[, c(6:22)], 2, function(x)
    sum(as.numeric(x)))

progression_completion <-
  data.table(
    course_stage = 1:length(prp_progression_completion),
    `Completions` = prp_progression_completion,
    `Non-Completions` = 1 - prp_progression_completion
  ) |>
  melt(id.vars = "course_stage")

progression_completion[, variable := factor(variable,
                                            levels = c("Non-Completions", "Completions"),)]

progression_completion |>
  ggplot(aes(x = course_stage, y = value, fill = variable)) +
  geom_col() +
  scale_fill_brewer(type = "qual",
                    palette = 3) +
  labs(x = "Stage of Online Course",
       y = NULL,
       fill = NULL) +
  theme_bw() +
  theme(legend.position = "bottom") +
  scale_y_continuous(labels = percent_format())
We can look at the raw counts of individuals dropping off at each point (Table 2). What we can see is that 20 individuals dropped off after the introduction of the course and 7 dropped off at the first quiz. This could suggest that upon learning what the course involves, individuals became less inclined to continue. Moreover, the use of quizzes could be off putting for some.
diff(count_progression_completion) |>
  as.data.table(keep.rownames = T) |>
kable(col.names = c("Course Component", "Drop Off Count"))| Course Component | Drop Off Count |
|---|---|
| activity_know_your_personality_a_fun_way | -20 |
| a_simple_quiz_on_the_previous_video | -7 |
| lets_see_what_product_is | 0 |
| a_simple_quiz_on_the_previous_video_2 | -3 |
| product_that_represents_me | -4 |
| lets_see_what_service_means | -1 |
| a_simple_quiz_on_the_previous_video_3 | -1 |
| instruction_for_product_amp_service_worksheet | 0 |
| activity_product_and_service_worksheet | -2 |
| instructions_for_product_word_association | 0 |
| activity_product_word_association | -2 |
| life_without_products_impossible | 0 |
| what_is_a_need | -1 |
| a_simple_quiz_on_the_previous_video_4 | -3 |
| summary_of_session_1 | 0 |
| your_feedback_on_session_1 | 0 |
Time to Complete
As we have timestamps for each completion activity, we can explore the time between activities. This can indicate how long individuals are spending on each activity, potentially showing whether they are skimming through content quickly or taking their time. Although this is not a definitive measure of time-on-task, it serves as an adequate proxy.
To calculate time to complete, we follow these steps:
Extract the timestamp from the completion status cell.
Within each individual, we create a new column containing the preceding activity completion timestamp.
Calculate the time difference between the current and preceding activity and convert it to minutes.
This leaves us with a metric of the time taken between each activity completion.
completion_time <-
  lms_engagement[, c(1, 6:22)] |>
  melt(id.vars = "child_name",
       variable.name = "course_component",
       value.name = "completion_status")

completion_time[,
                time_stamp_format :=
                  str_trim(str_replace_all(completion_status, "^Completed|\\([A-Za-z ]+\\)|,", ""))]

completion_time <-
  completion_time[!grepl("^Not completed", time_stamp_format)]

completion_time[,
                time_stamp_format := as.POSIXct(strptime(time_stamp_format, format = "%A %d %B %Y %I:%M %p"))]

completion_time[,
                lag_time := shift(time_stamp_format, type = "lag", n = 1),
                by = "child_name"]

completion_time[, time_difference :=
                  difftime(time_stamp_format, lag_time, units = "mins"),
                by = "child_name"]
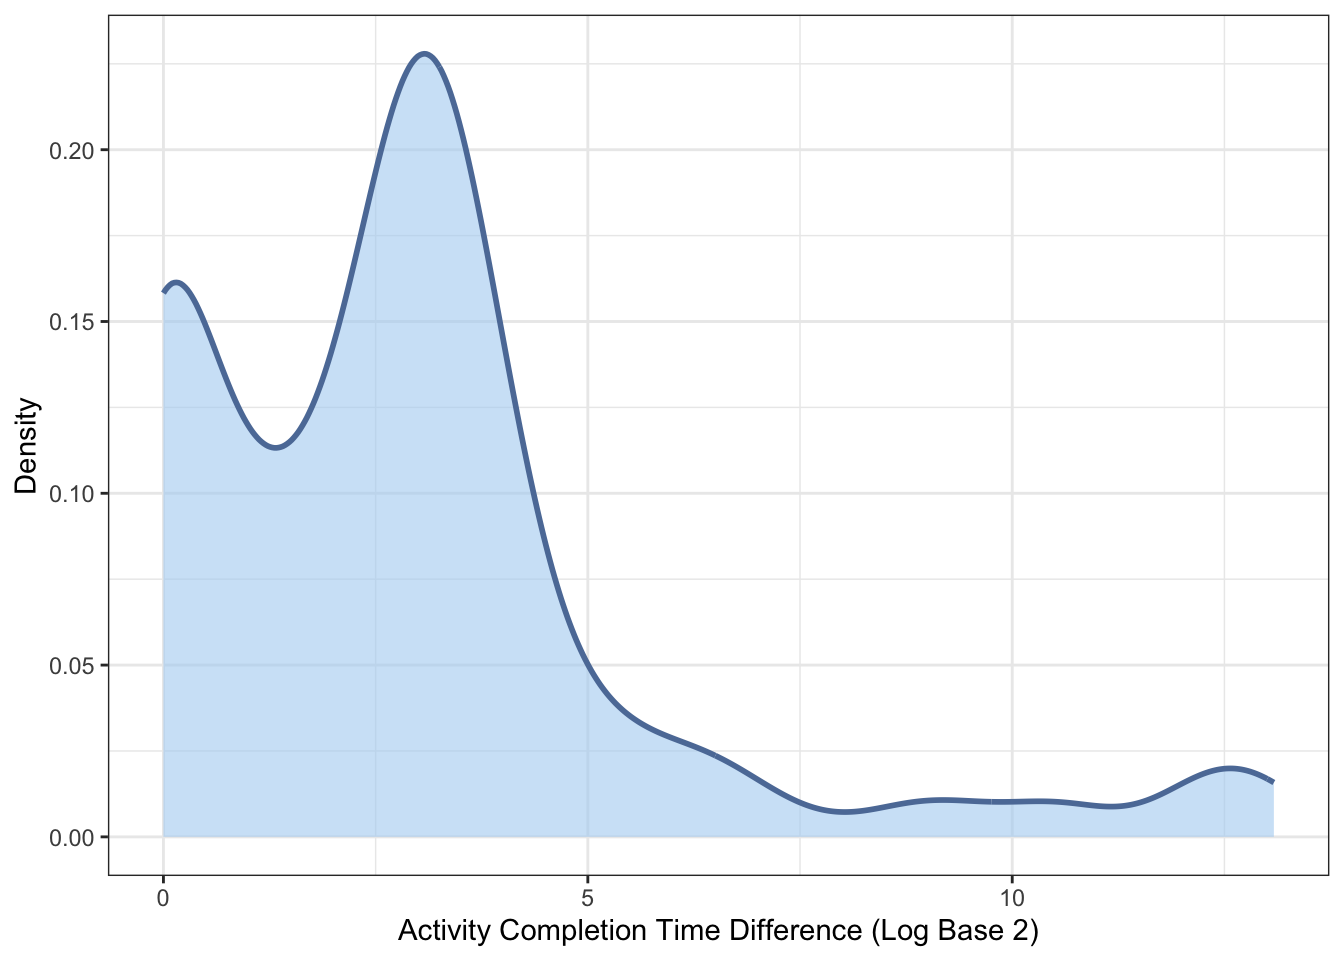
Figure 2 presents the distribution of time completion responses across all individuals and activities. Three key points can be taken away:
There's a peak at 0, indicating that many individuals took 1 minute to complete activities.
Another peak is found around 4, suggesting that a large proportion spent 16 on activities.
There is a large tail to the distribution, likely indicating that some individuals took a break and came back after several hours, as 10 refers to 1024 minutes.
completion_time |>
  ggplot(aes(x = log2(as.numeric(time_difference)))) +
  geom_density(
    alpha = .6,
    colour = "#5D7CA6",
    fill = "#AED3F2",
    linewidth = 1
  ) +
  labs(x = "Activity Completion Time Difference (Log Base 2)",
       y = "Density") +
theme_bw() 
As a final step, we can look at the median time taken to complete an activity (Table 3). Since we don't have a time for when the individual started the whole course, there's no value for the Introduction.
What we can see is that individuals do spend a moderate amount of time on certain content.
For example, they spent an average of 12 minutes on “activity_know_your_personality_a_fun_way” and 11 minutes on “a_simple_quiz_on_the_previous_video_2”.
However, for “lets_see_what_product_is” and “life_without_products_impossible”, it appears that most skip this content.
completion_time[,
                .(mdn_completion_time = median(time_difference)),
                by = "course_component"] |>
kable(col.names = c("Course Component", "Median Time to Complete"))| Course Component | Median Time to Complete |
|---|---|
| introduction | NA mins |
| activity_know_your_personality_a_fun_way | 12 mins |
| a_simple_quiz_on_the_previous_video | 2 mins |
| lets_see_what_product_is | 0 mins |
| a_simple_quiz_on_the_previous_video_2 | 11 mins |
| product_that_represents_me | 8 mins |
| lets_see_what_service_means | 1 mins |
| a_simple_quiz_on_the_previous_video_3 | 9 mins |
| instruction_for_product_amp_service_worksheet | 0 mins |
| activity_product_and_service_worksheet | 6 mins |
| instructions_for_product_word_association | 0 mins |
| activity_product_word_association | 13 mins |
| life_without_products_impossible | 0 mins |
| what_is_a_need | 6 mins |
| a_simple_quiz_on_the_previous_video_4 | 10 mins |
| summary_of_session_1 | 1 mins |
| your_feedback_on_session_1 | 5 mins |
Summary
Learning Analytics can offer valuable insights into engagement with learning content. Despite the investment in the design and setup of an LMS, Learning Analytics may reveal that most students/employees are not actively using the platform. Moreover, it may show that they are skimming through material primarily to mark the content as completed. Completion rates alone offer only part of the picture. It is necessary to leverage granular data to explore the time individuals are spending on content. Not everyone approaches learning in the same way; there will be those who invest time in professional learning content.